Fig. 6
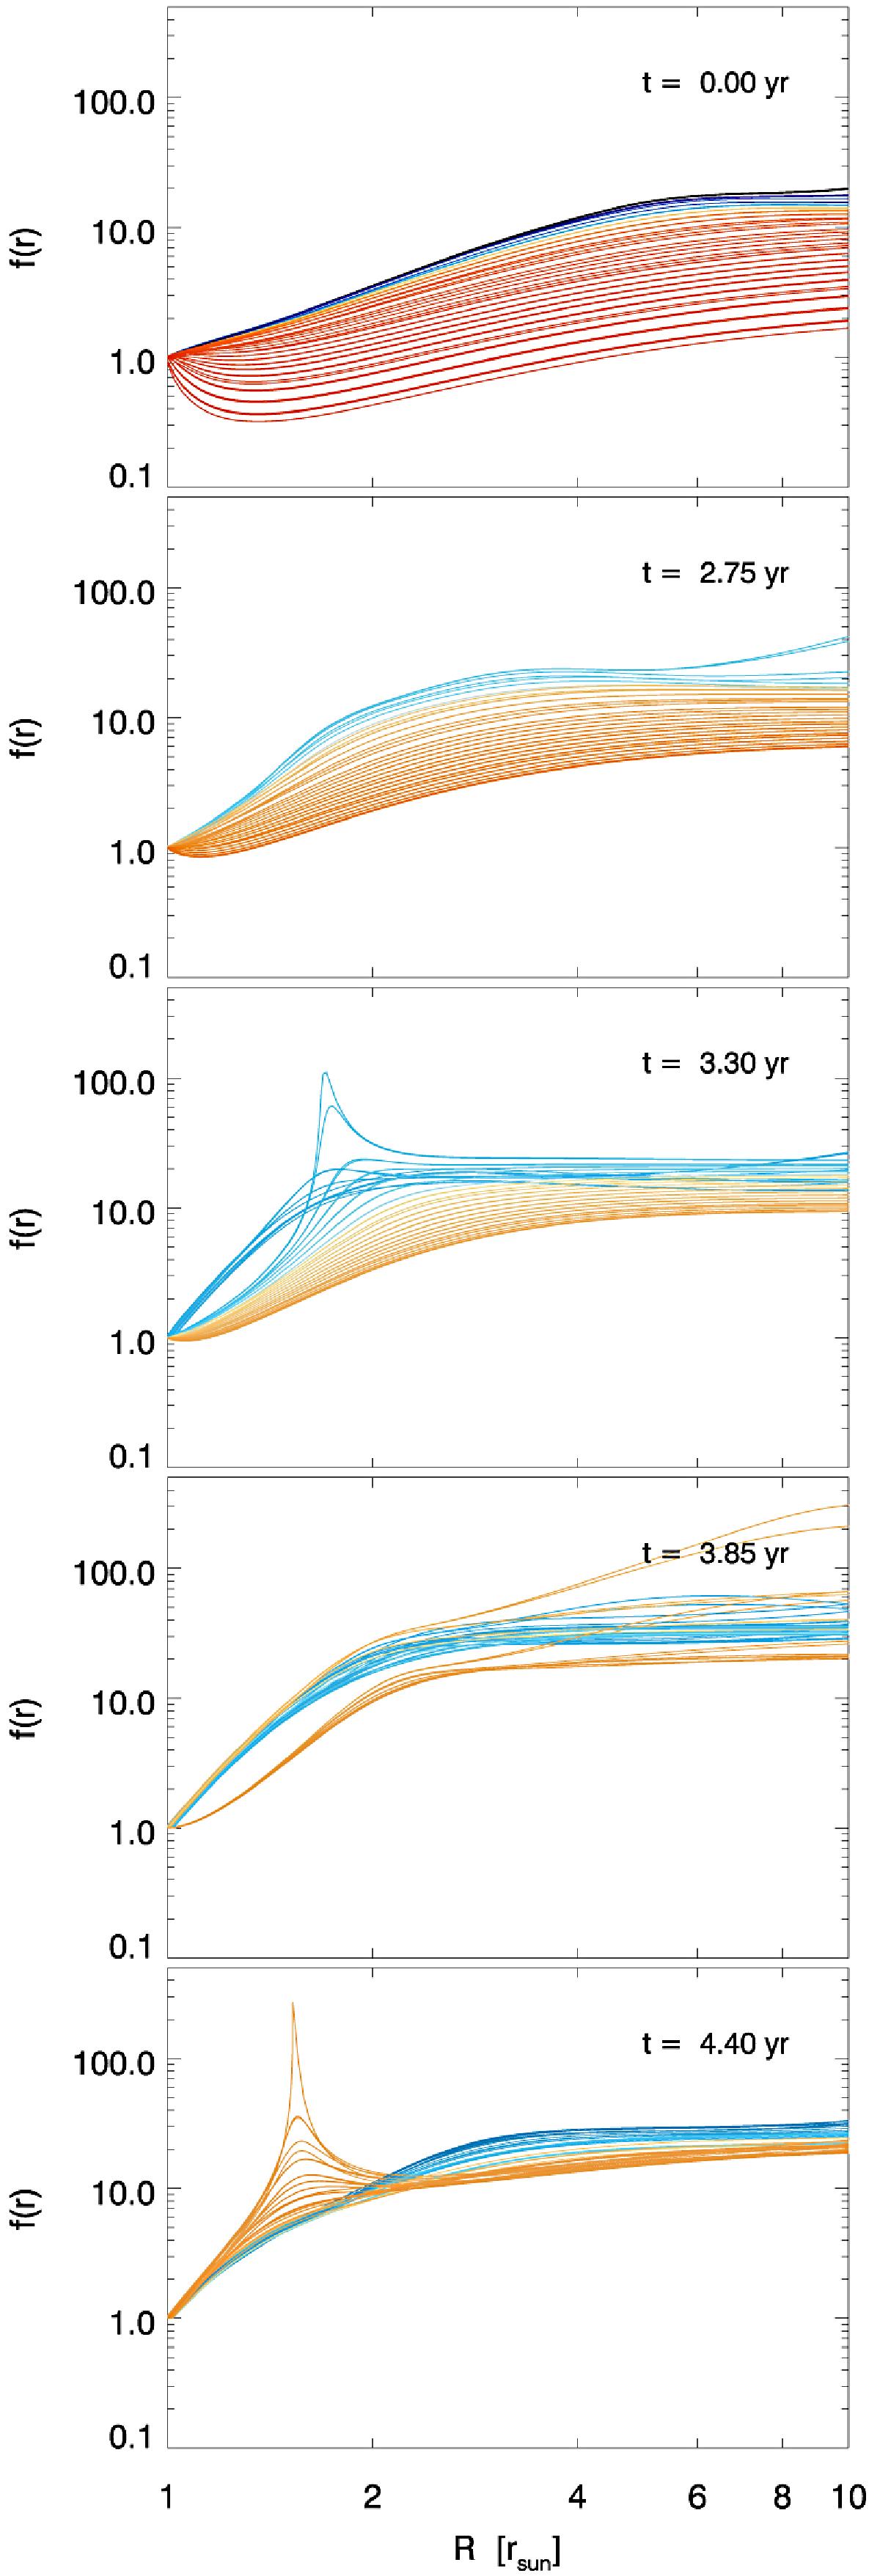
Profiles of the expansion factors as a function of the distance to the surface ![]() corresponding to flux-tubes at different latitudes at five different instants (from the top to the bottom panel: t = 0, 2.75, 3.30, 3.85, 4.40 yr). The curves are coloured according to the asymptotic wind speed, as in the previous figures. The figures show that the terminal wind speed is anti-correlated with the total expansion factor (the value of
corresponding to flux-tubes at different latitudes at five different instants (from the top to the bottom panel: t = 0, 2.75, 3.30, 3.85, 4.40 yr). The curves are coloured according to the asymptotic wind speed, as in the previous figures. The figures show that the terminal wind speed is anti-correlated with the total expansion factor (the value of ![]() at r ≫ 1 R⊙), especially when close to the solar minimum, but does not so much on the details of
at r ≫ 1 R⊙), especially when close to the solar minimum, but does not so much on the details of ![]() at low altitudes.
at low altitudes.
Current usage metrics show cumulative count of Article Views (full-text article views including HTML views, PDF and ePub downloads, according to the available data) and Abstracts Views on Vision4Press platform.
Data correspond to usage on the plateform after 2015. The current usage metrics is available 48-96 hours after online publication and is updated daily on week days.
Initial download of the metrics may take a while.