Open Access
Fig. 2
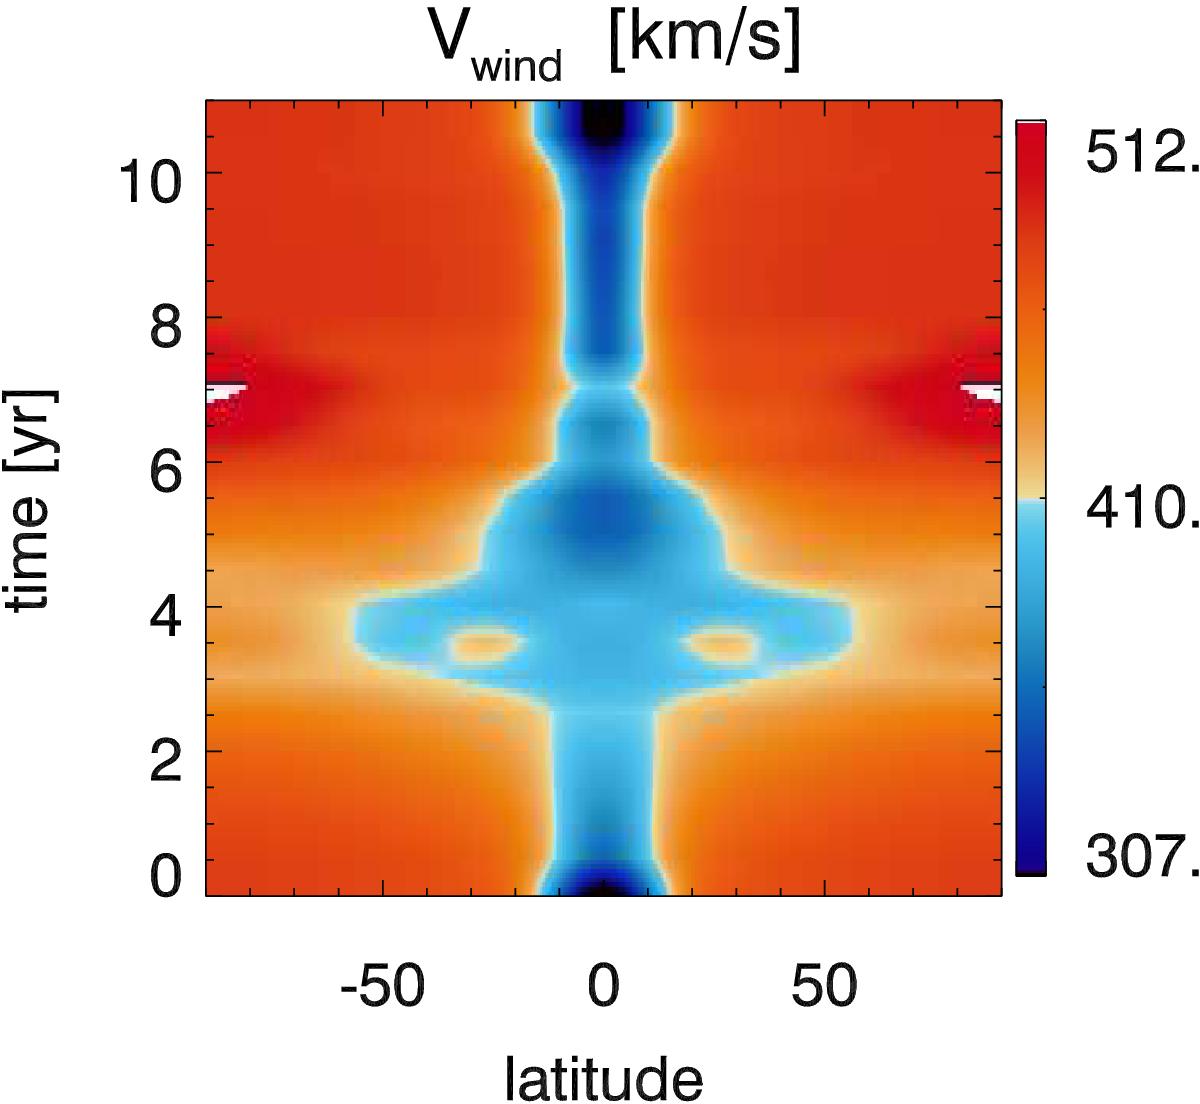
Time-latitude diagram of the terminal wind speed covering 11 yr of the solar cycle (y-axis) and 180 deg of latitude (from north to south pole, x-axis). The colour-scheme is the same as in the field lines plotted in Fig. 1.
Current usage metrics show cumulative count of Article Views (full-text article views including HTML views, PDF and ePub downloads, according to the available data) and Abstracts Views on Vision4Press platform.
Data correspond to usage on the plateform after 2015. The current usage metrics is available 48-96 hours after online publication and is updated daily on week days.
Initial download of the metrics may take a while.