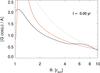
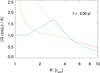
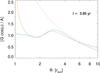
Fig. 13
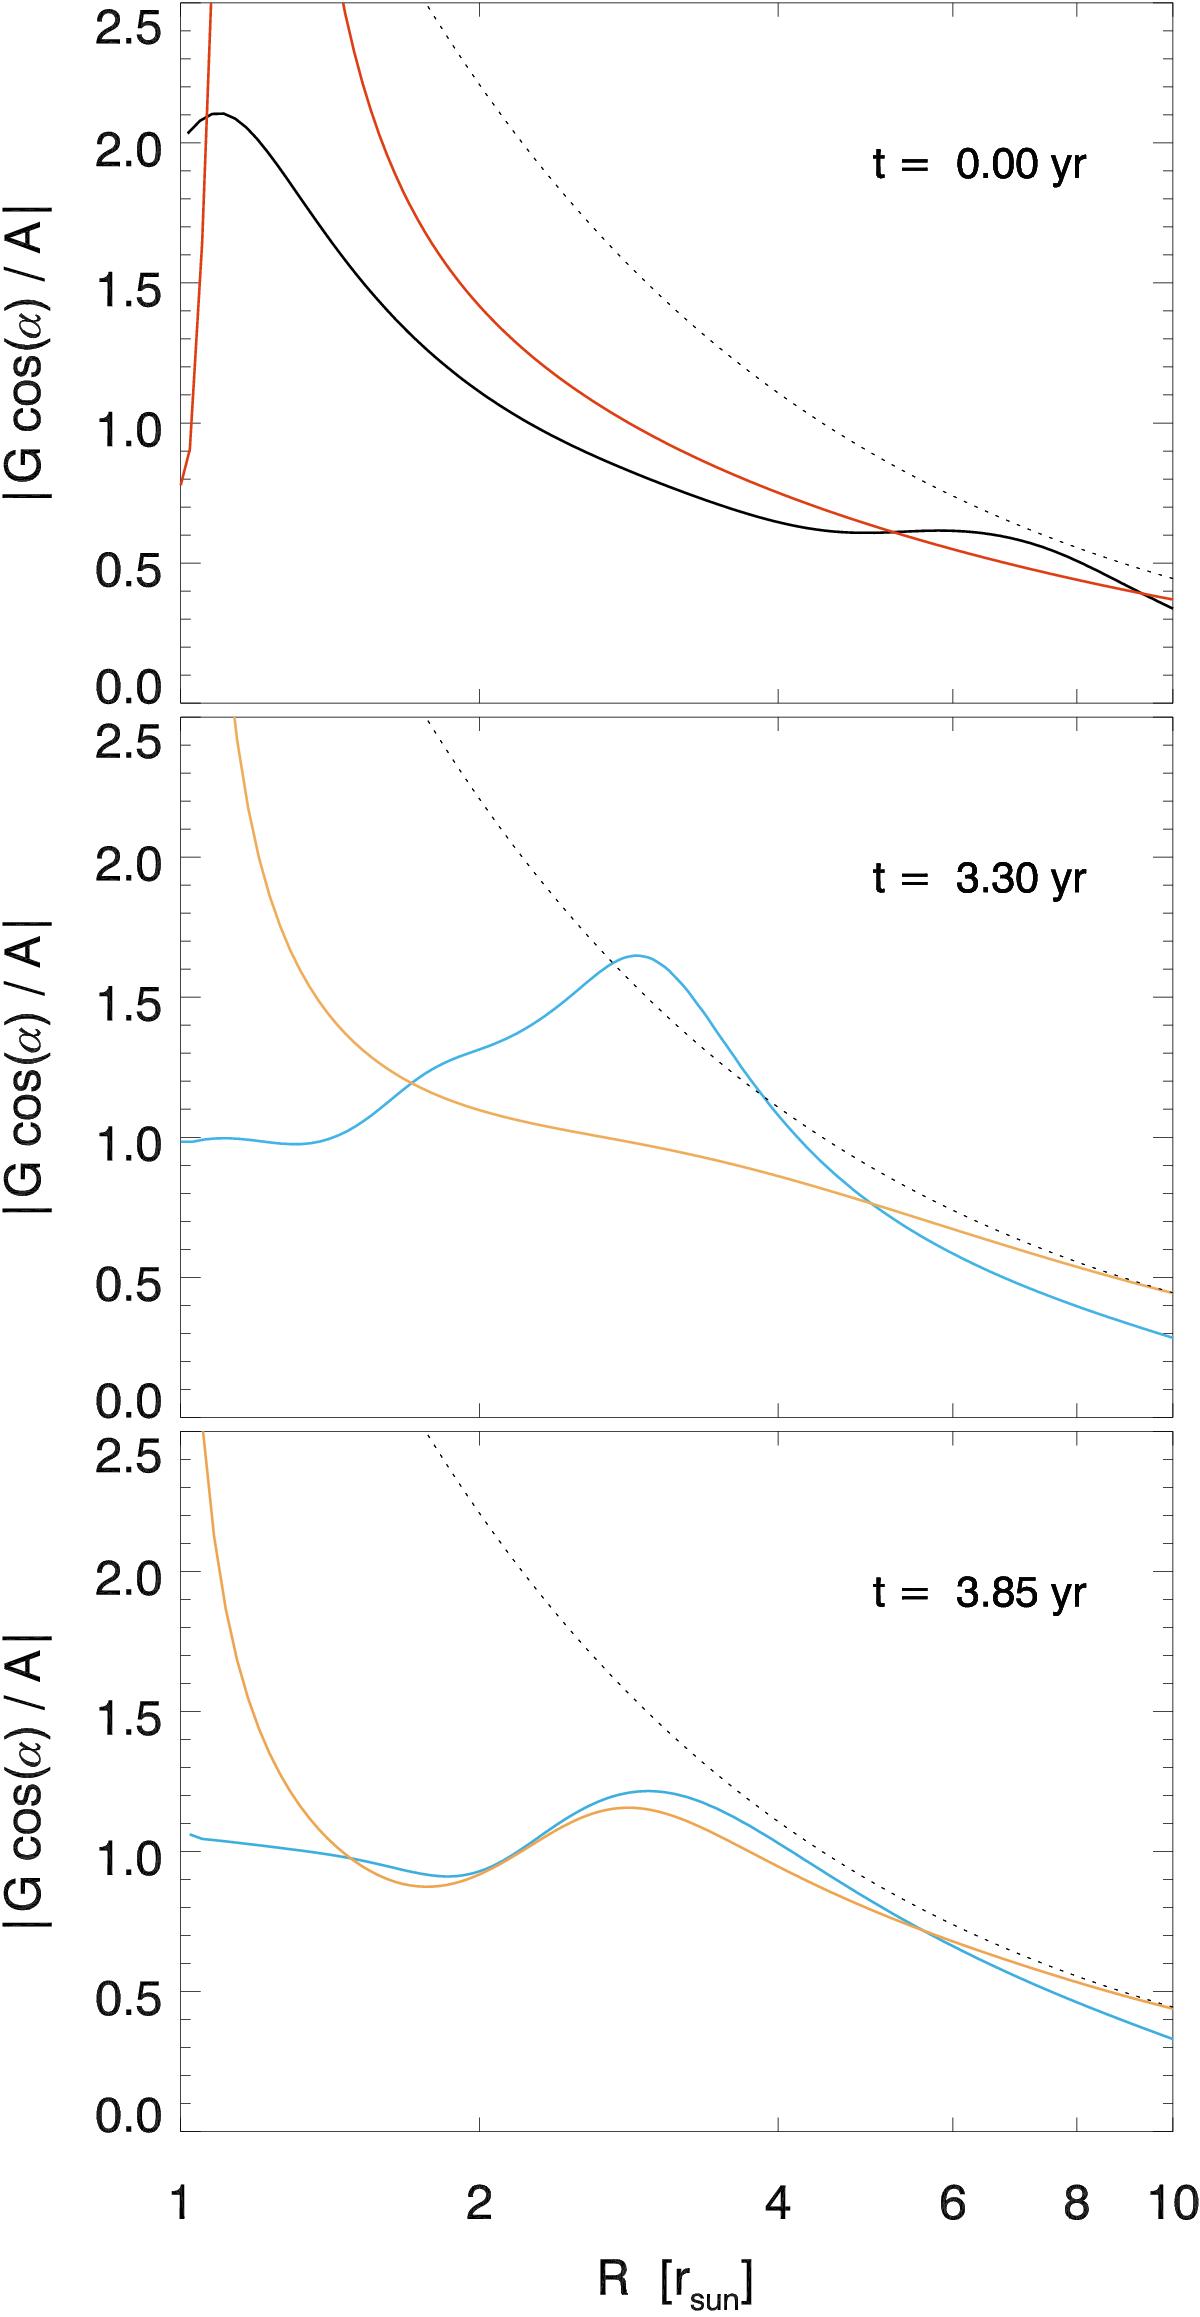
Ratio of the absolute value of the two terms on the right-hand side of Eq. (5) as a function of the distance to the surface for the flux-tubes which carry the fastest and the slowest wind flow at three different instants of the cycles (the same as in Fig. 12). The black dotted line shows the value of this ratio for a vertically aligned and radially expanding wind flow (a Parker wind) for comparison.
Current usage metrics show cumulative count of Article Views (full-text article views including HTML views, PDF and ePub downloads, according to the available data) and Abstracts Views on Vision4Press platform.
Data correspond to usage on the plateform after 2015. The current usage metrics is available 48-96 hours after online publication and is updated daily on week days.
Initial download of the metrics may take a while.