Fig. 1
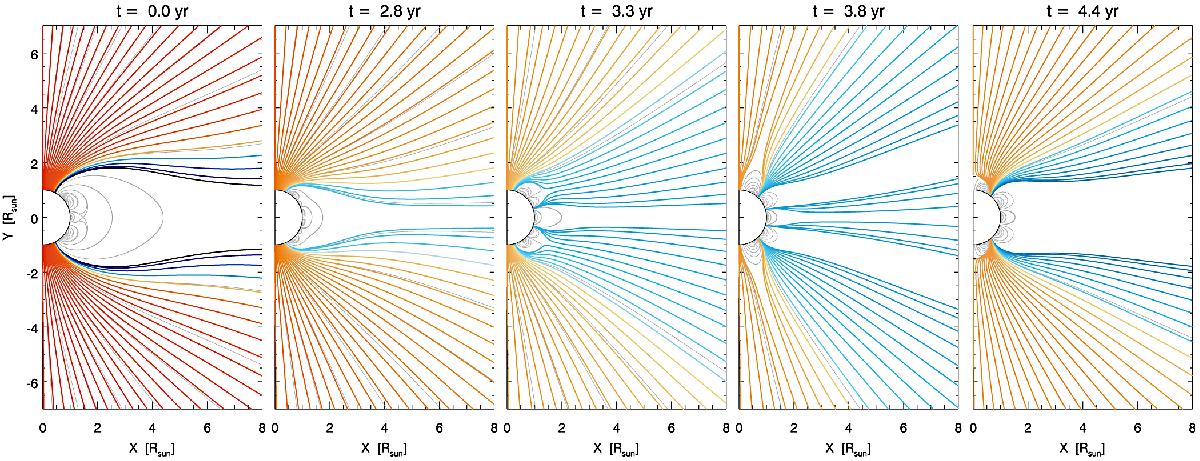
Structure of the coronal magnetic field at five representative instants of the modelled solar cycle. The times are, from left to right, t = 0, 2.75 ,3.30, 3.80, 4.40 yr corresponding, respectively, to the activity minimum, the early rising phase, the late rising phase, the maximum, and the declining phase of the cycle. The field lines are coloured according to the terminal speed of the wind (at the outer boundary of the domain, r = 15 R⊙) flowing along each one (dark red and orange represent fast wind flows, and blue slow wind flows; cf. the colourbar in Fig. 2). The grey lines represent closed field lines, for completeness.
Current usage metrics show cumulative count of Article Views (full-text article views including HTML views, PDF and ePub downloads, according to the available data) and Abstracts Views on Vision4Press platform.
Data correspond to usage on the plateform after 2015. The current usage metrics is available 48-96 hours after online publication and is updated daily on week days.
Initial download of the metrics may take a while.