Free Access
Fig. 7
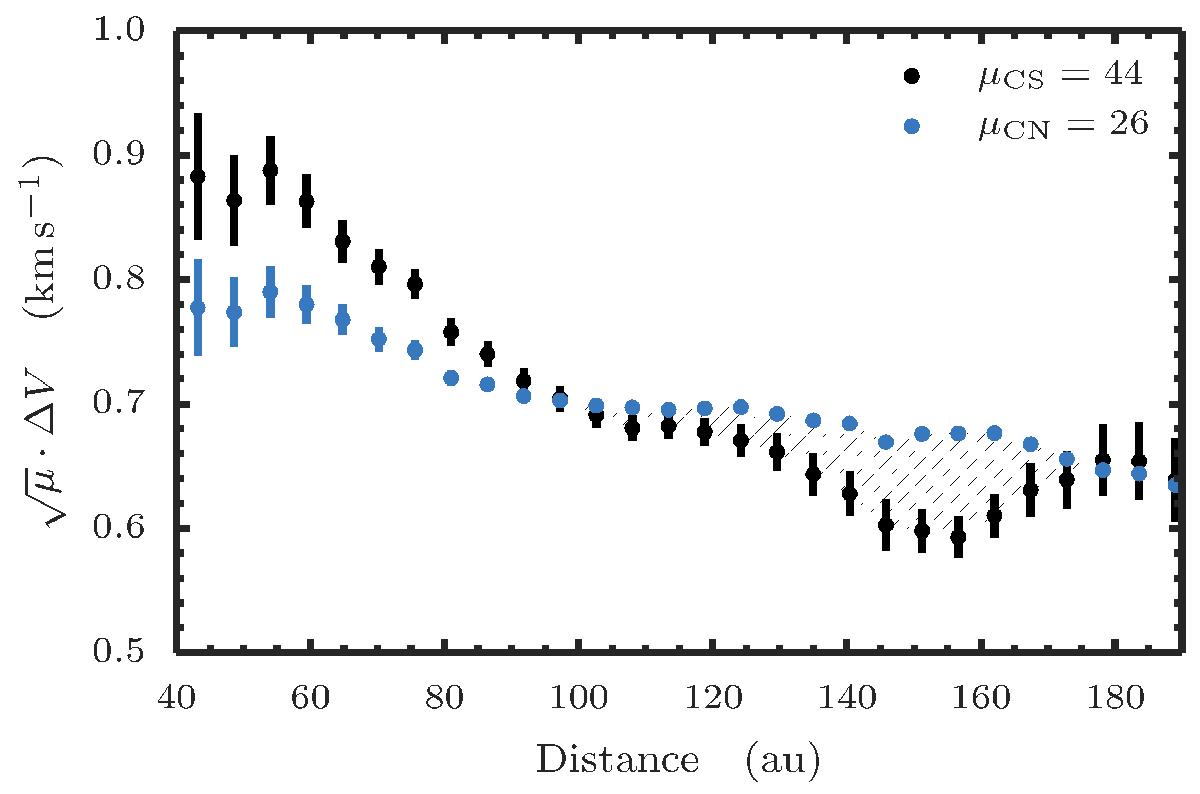
Comparing the ![]() scaled line widths for CN (blue) and CS (black). The region where the scaled line width of CS drops below the values for CN, 100 ≲ r ≲ 170 au, shown by the dashes, is where the co-spatial assumption can not be true. Error bars show 1σ uncertainties on the mean.
scaled line widths for CN (blue) and CS (black). The region where the scaled line width of CS drops below the values for CN, 100 ≲ r ≲ 170 au, shown by the dashes, is where the co-spatial assumption can not be true. Error bars show 1σ uncertainties on the mean.
Current usage metrics show cumulative count of Article Views (full-text article views including HTML views, PDF and ePub downloads, according to the available data) and Abstracts Views on Vision4Press platform.
Data correspond to usage on the plateform after 2015. The current usage metrics is available 48-96 hours after online publication and is updated daily on week days.
Initial download of the metrics may take a while.