Free Access
Fig. 4
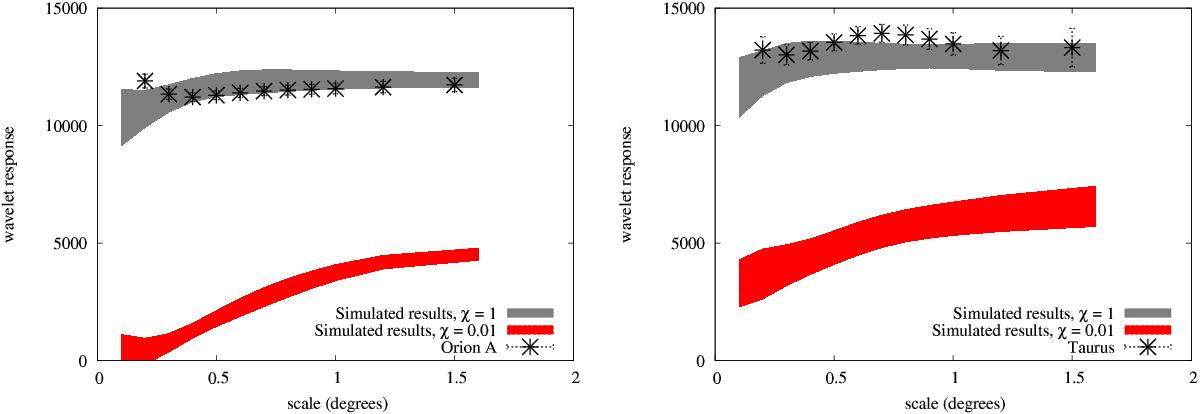
The wavelet response of Orion A (left panel) and Taurus (right panel), respectively. Gray shaded areas show the simulation results assuming a uniform CR density at all scales, while the red areas show the results when assuming a smaller diffusion coefficient inside MC.
This figure is made of several images, please see below:
Current usage metrics show cumulative count of Article Views (full-text article views including HTML views, PDF and ePub downloads, according to the available data) and Abstracts Views on Vision4Press platform.
Data correspond to usage on the plateform after 2015. The current usage metrics is available 48-96 hours after online publication and is updated daily on week days.
Initial download of the metrics may take a while.