Free Access
Fig. 3
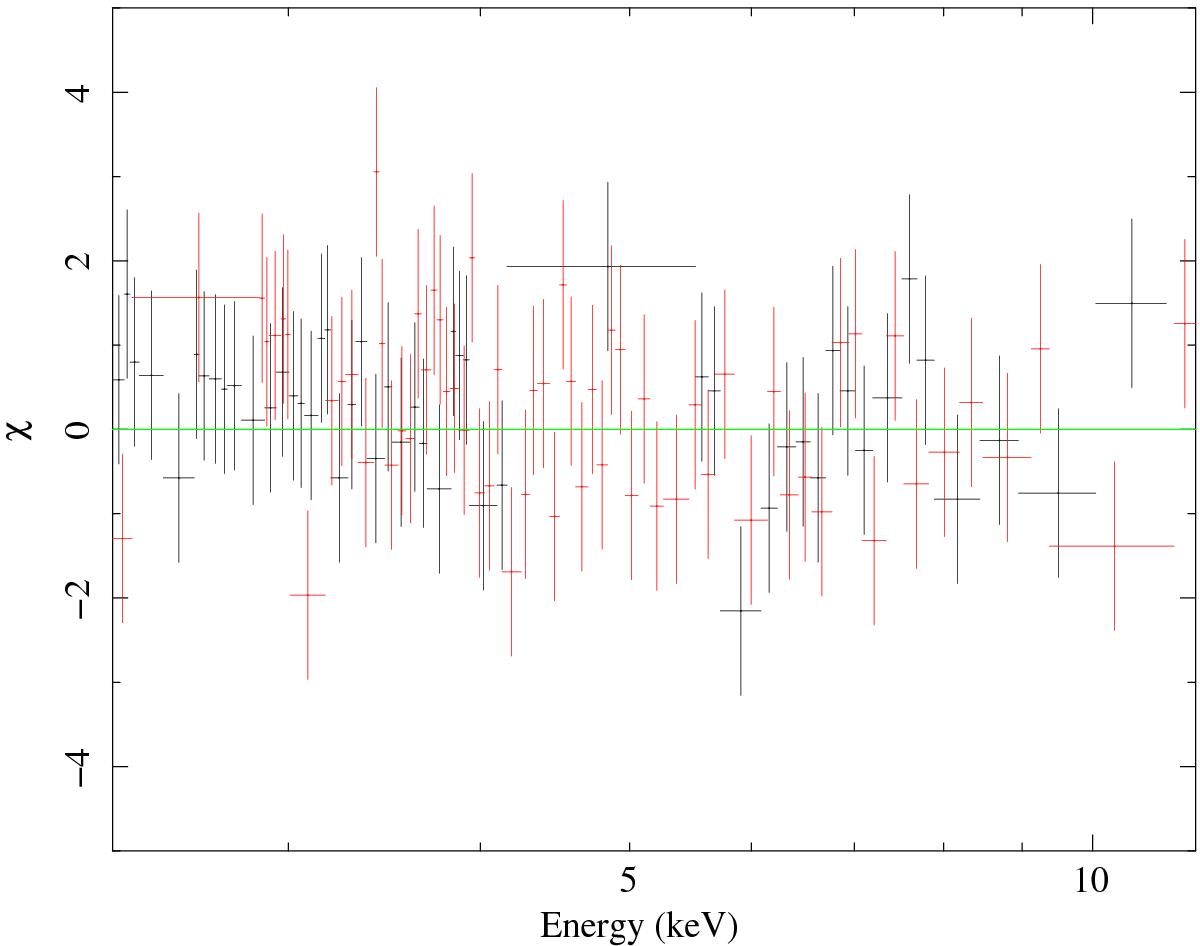
Rest-frame data-to-model ratio expressed in terms of standard deviations after the RGS data are fit with model 1 of Table 1. Data have been rebinned so as to have 20 source plus counts per energy bin. RGS1 and RGS2 data points are plotted in black and red, respectively.
Current usage metrics show cumulative count of Article Views (full-text article views including HTML views, PDF and ePub downloads, according to the available data) and Abstracts Views on Vision4Press platform.
Data correspond to usage on the plateform after 2015. The current usage metrics is available 48-96 hours after online publication and is updated daily on week days.
Initial download of the metrics may take a while.