Fig. 2
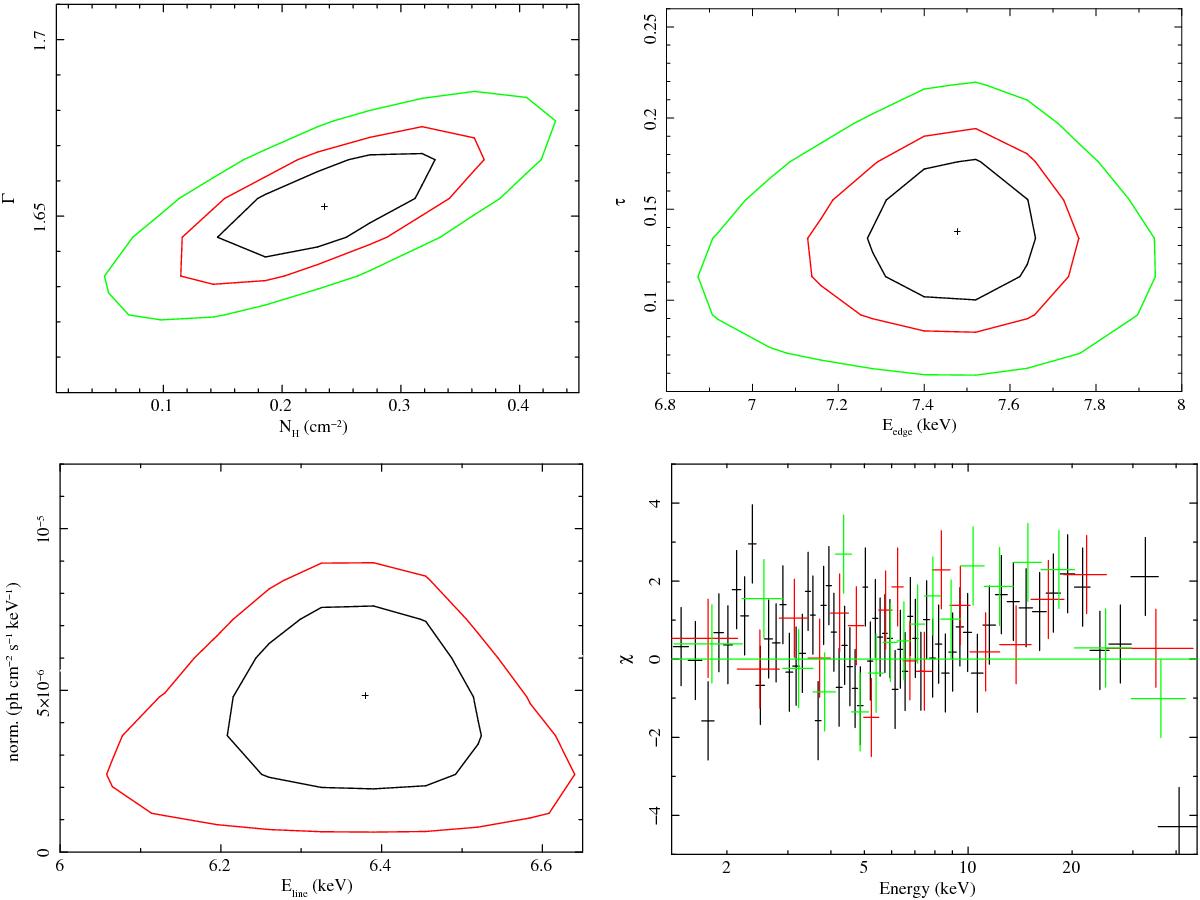
Contour plots at 99, 90, and 68% confidence obtained using a model composed of a primary power-law absorbed by a cold column and by an edge at E ~ 7.5 keV plus a Gaussian in emission (model 3 in Table 1). From left to right: (upper left panel) photoindex Γ vs. absorbing column density (NH in units of 1022); (upper right panel) optical depth of the edge (τ) vs. its energy centroid; (lower left panel) Gaussian emission line normalization vs. its energy. In this case, only 90 and 68% confidence contours are presented since the emission Gaussian line is detected with ~97% confidence in this model and the 99% confidence contour gives only an upper limit; (lower right panel) data-to-model ratio expressed in terms of standard deviations. Binning and colors as in Fig. 1.
Current usage metrics show cumulative count of Article Views (full-text article views including HTML views, PDF and ePub downloads, according to the available data) and Abstracts Views on Vision4Press platform.
Data correspond to usage on the plateform after 2015. The current usage metrics is available 48-96 hours after online publication and is updated daily on week days.
Initial download of the metrics may take a while.