Fig. 5
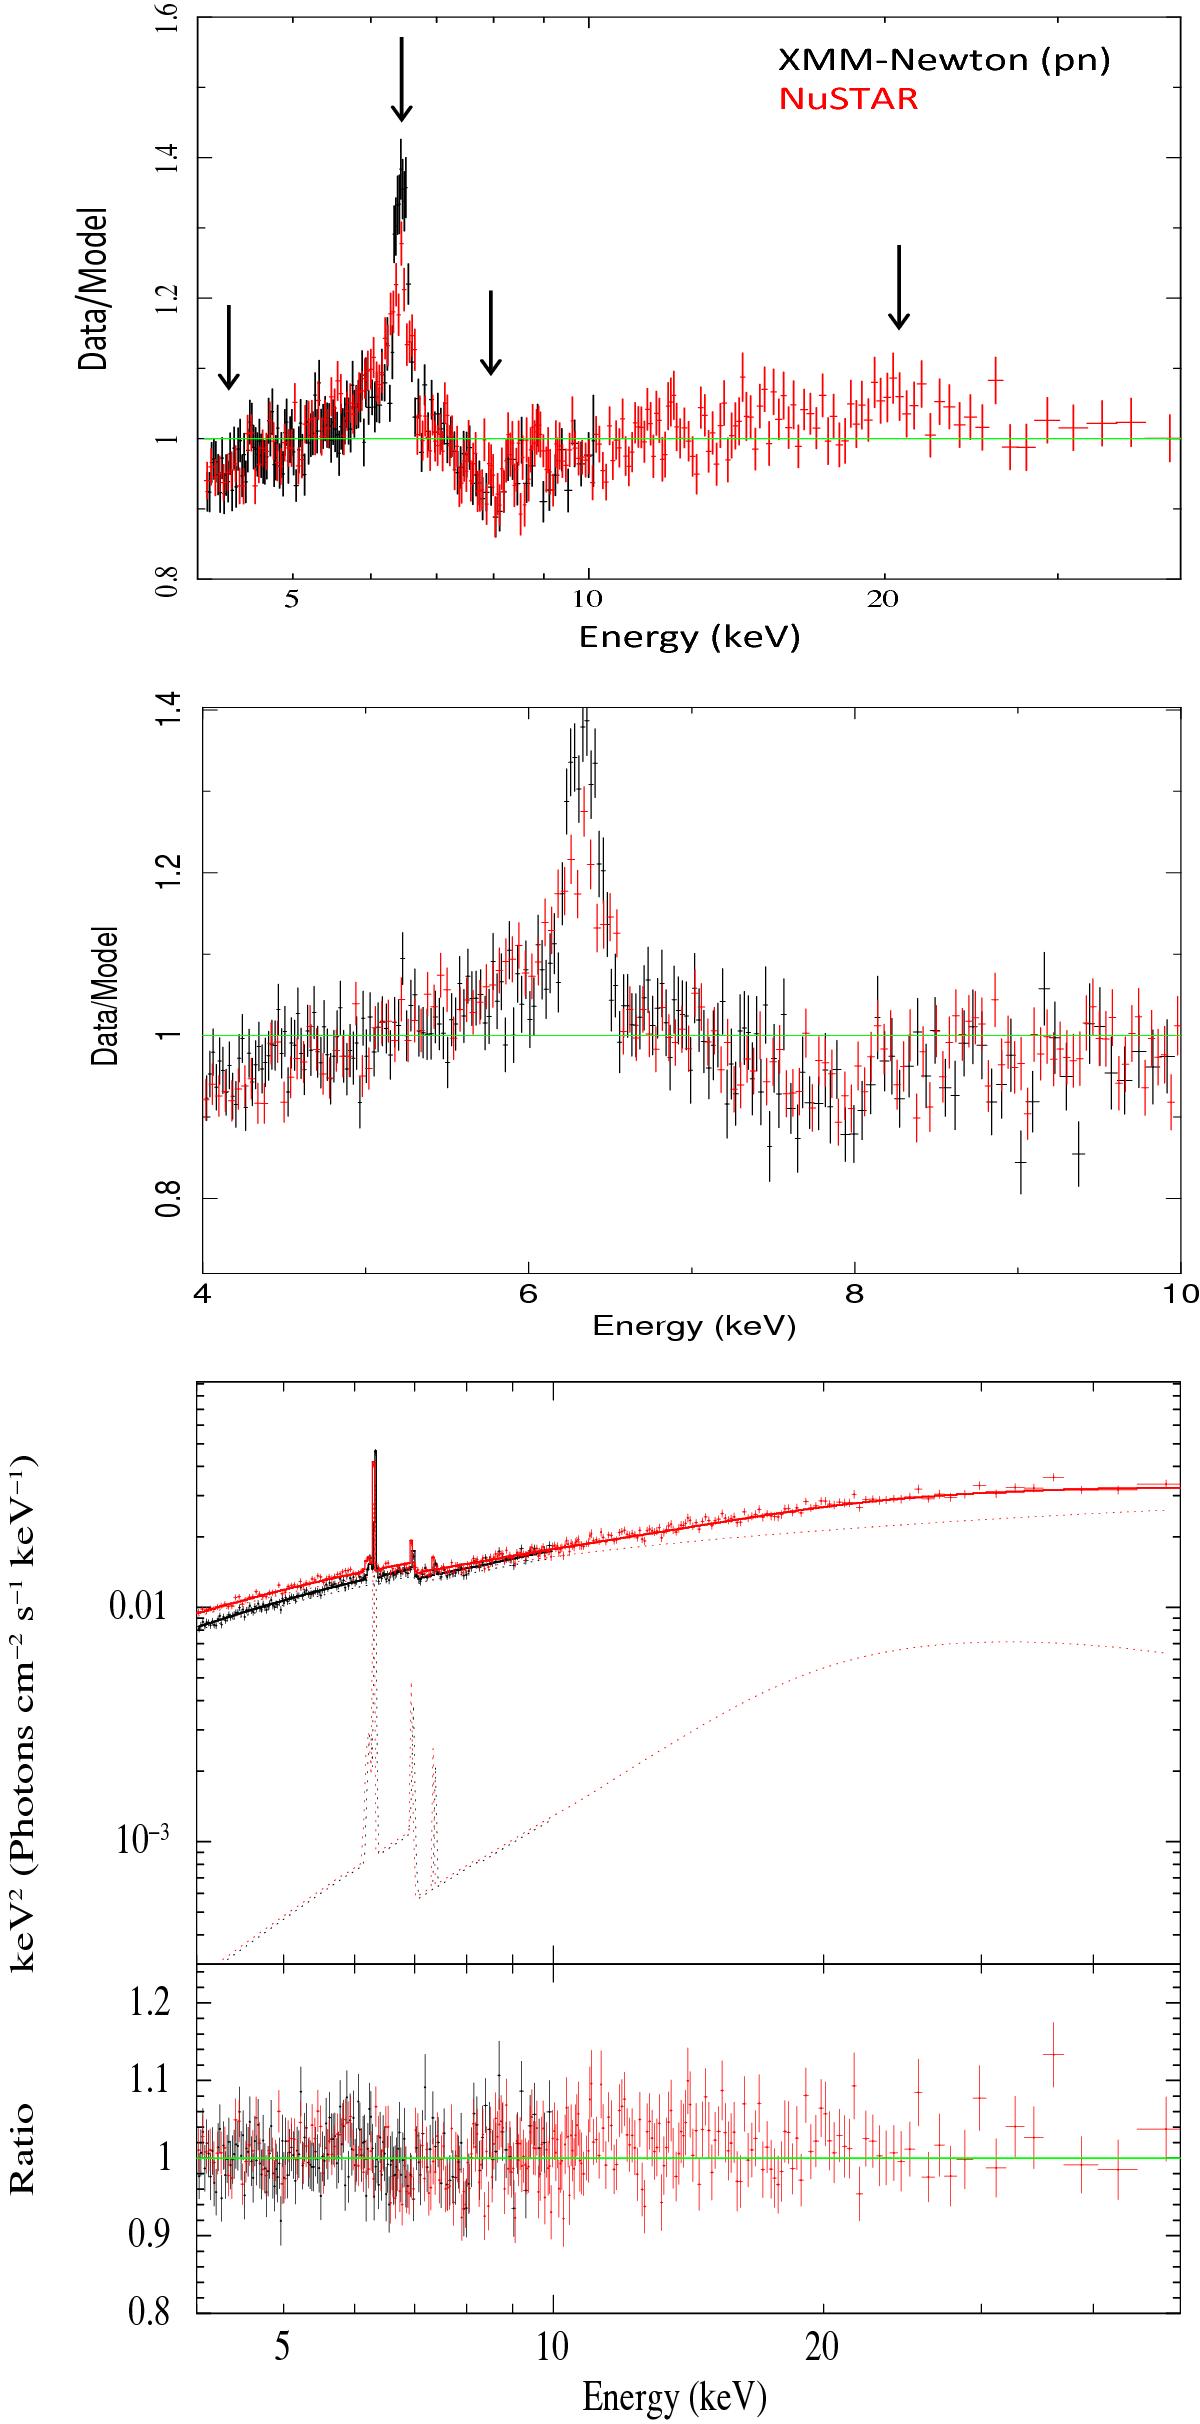
Top: data are plotted as the ratio to a single power-law continuum model fitted to the grouped observations M4N, M8N, and M13N with XMM-Newton (black) and NuSTAR (red) simultaneous data. As indicated by the arrows, going from low to high energies, one can clearly note the presence of: a sharp low-energy cut-off, a narrow Fe K line at ~6.4 keV, some absorption feature(s) between 7−8 keV, and a high energy hump between 10−30 keV. Middle: same as top panel, but zoomed between 4 and 10 keV. Bottom: best-fit spectrum, model, and ratios plotted between 4−50 keV (see Sect. 4.1.1 for details).
Current usage metrics show cumulative count of Article Views (full-text article views including HTML views, PDF and ePub downloads, according to the available data) and Abstracts Views on Vision4Press platform.
Data correspond to usage on the plateform after 2015. The current usage metrics is available 48-96 hours after online publication and is updated daily on week days.
Initial download of the metrics may take a while.