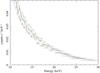
Fig. 4
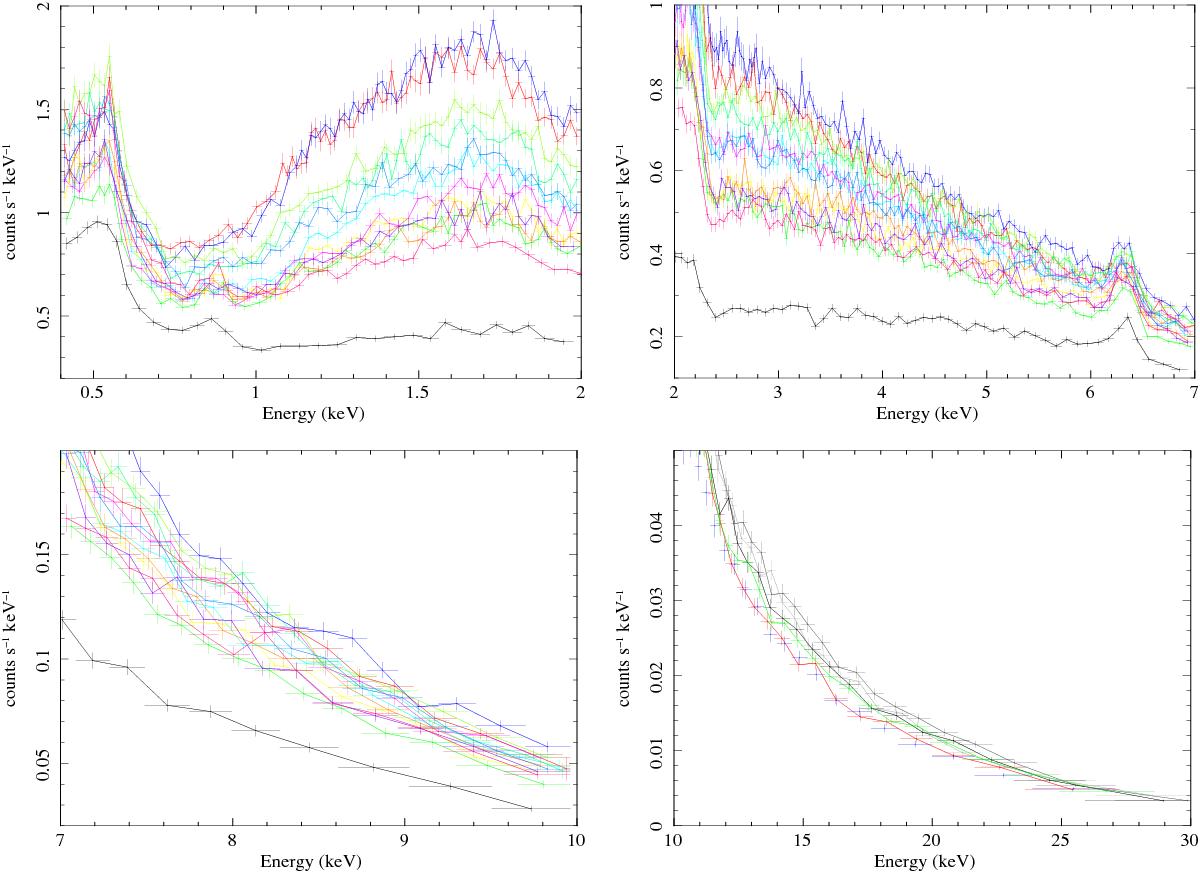
X-ray spectra obtained during the campaign (M1→M14, including the simultaneous M4N, M8N and M13N NuSTAR observations plotted above 10 keV) plotted on linear scales, and with the same factor of ~10 extension range (from bottom to top) in the y-axis scale intensities. These are shown to illustrate the important and complex variability as a function of energy up to 2 keV, and its gradual reduction above 2 keV, and up to 30 keV.
Current usage metrics show cumulative count of Article Views (full-text article views including HTML views, PDF and ePub downloads, according to the available data) and Abstracts Views on Vision4Press platform.
Data correspond to usage on the plateform after 2015. The current usage metrics is available 48-96 hours after online publication and is updated daily on week days.
Initial download of the metrics may take a while.