Free Access
Fig. 2
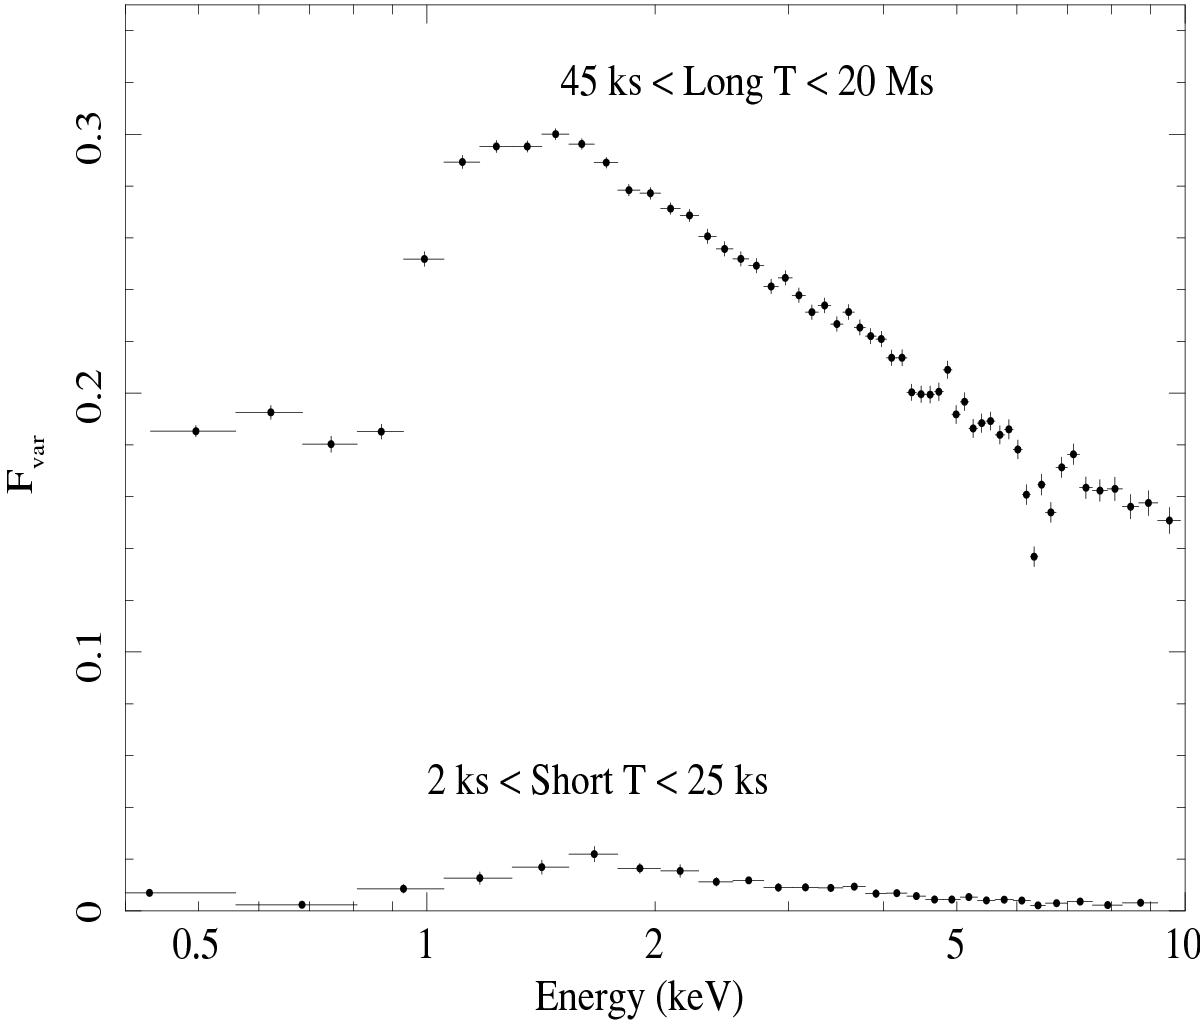
Fractional variability (rms) spectra of NGC 5548 calculated over long (45−2000 ks, top curve) timescales, i.e. longer than observations durations, but shorter than overall campaign, and over short (2−25 ks, bottom curve) timescales, i.e. longer than minimum time bin but shorter than shortest observation duration.
Current usage metrics show cumulative count of Article Views (full-text article views including HTML views, PDF and ePub downloads, according to the available data) and Abstracts Views on Vision4Press platform.
Data correspond to usage on the plateform after 2015. The current usage metrics is available 48-96 hours after online publication and is updated daily on week days.
Initial download of the metrics may take a while.