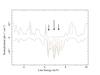
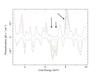
Fig. 15
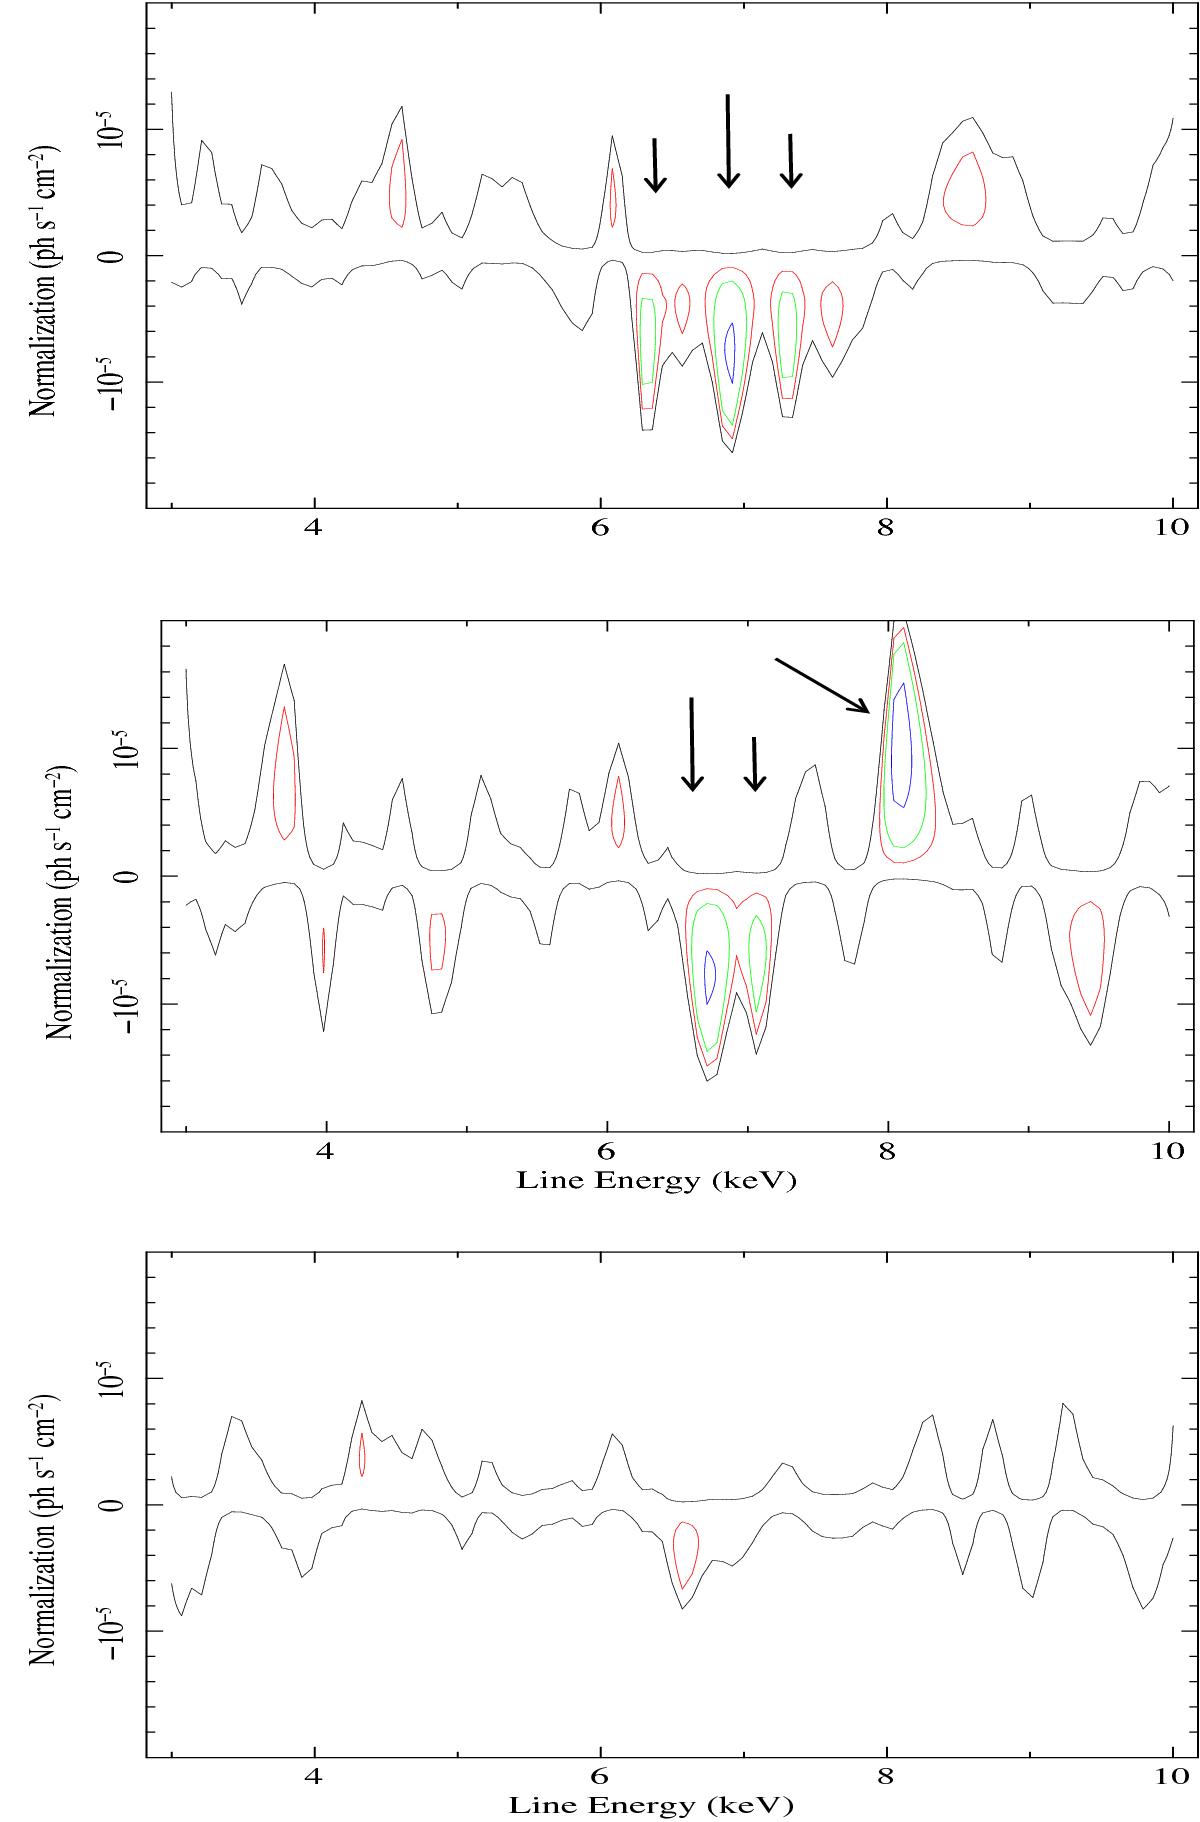
Three examples of confidence contours (Δχ2 = + 0.5,−2.3,−4.61, and −9.21 for the black, red, green, and blue contours, respectively) of energy vs. intensity of a narrow emission/absorption line between 3−10 keV during observations M2 (top panel), M10 (middle panel), and M3 (bottom panel). These illustrate the typical intensity of residuals left in the observation-by-observation best-fit spectra around 6−8 keV with (top and middle panels) and without residuals left (bottom panel).
Current usage metrics show cumulative count of Article Views (full-text article views including HTML views, PDF and ePub downloads, according to the available data) and Abstracts Views on Vision4Press platform.
Data correspond to usage on the plateform after 2015. The current usage metrics is available 48-96 hours after online publication and is updated daily on week days.
Initial download of the metrics may take a while.