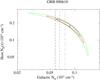
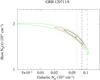
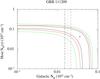
Fig. 2
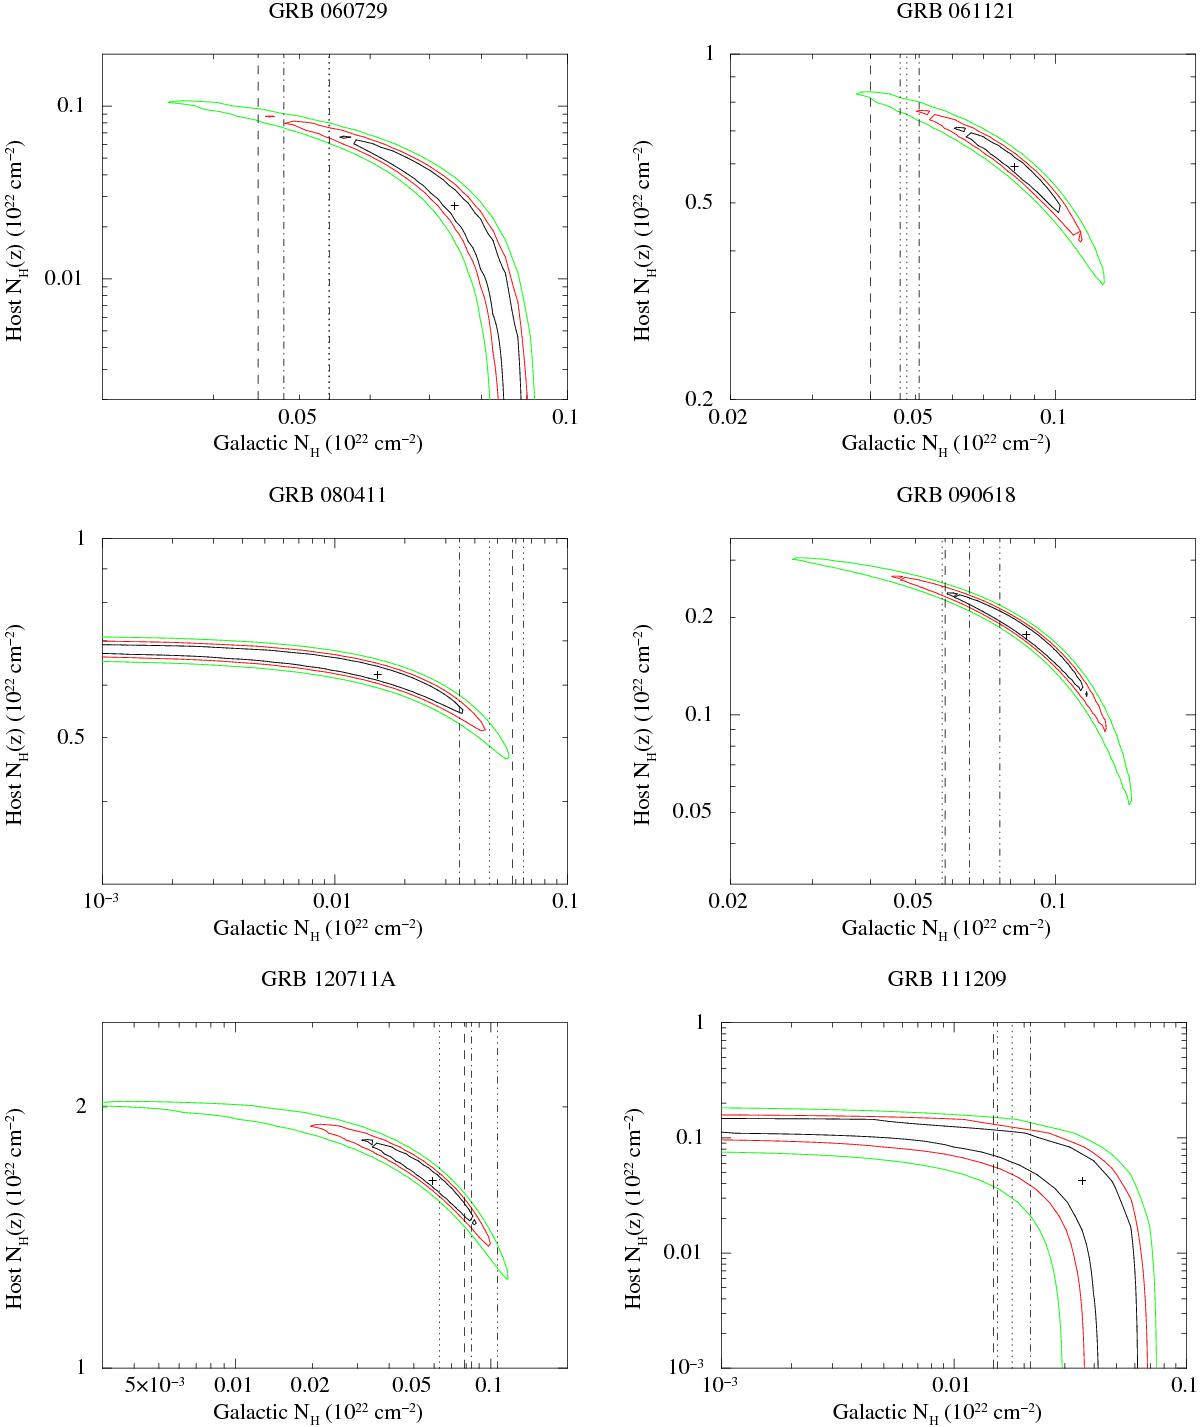
Galactic vs. intrinsic column densities contour plot for the six bursts of our samples. Vertical lines mark the Galactic column density derived from different estimates: dotted lines indicates the value adopted in the present paper (Kalberla et al. 2005, the value includes a 10% uncertainty); dashed lines the Kalberla et al. (2005) estimates, dot-dashed lines the Dickey & Lockman (1990) estimates, and dot-dot-dashed lines the Willingale et al. (2013) estimates. The cross in each contour plot marks the best-fit value. In the first panel the dot-dot-dashed line and the dotted line coincide.
Current usage metrics show cumulative count of Article Views (full-text article views including HTML views, PDF and ePub downloads, according to the available data) and Abstracts Views on Vision4Press platform.
Data correspond to usage on the plateform after 2015. The current usage metrics is available 48-96 hours after online publication and is updated daily on week days.
Initial download of the metrics may take a while.