Fig. 15
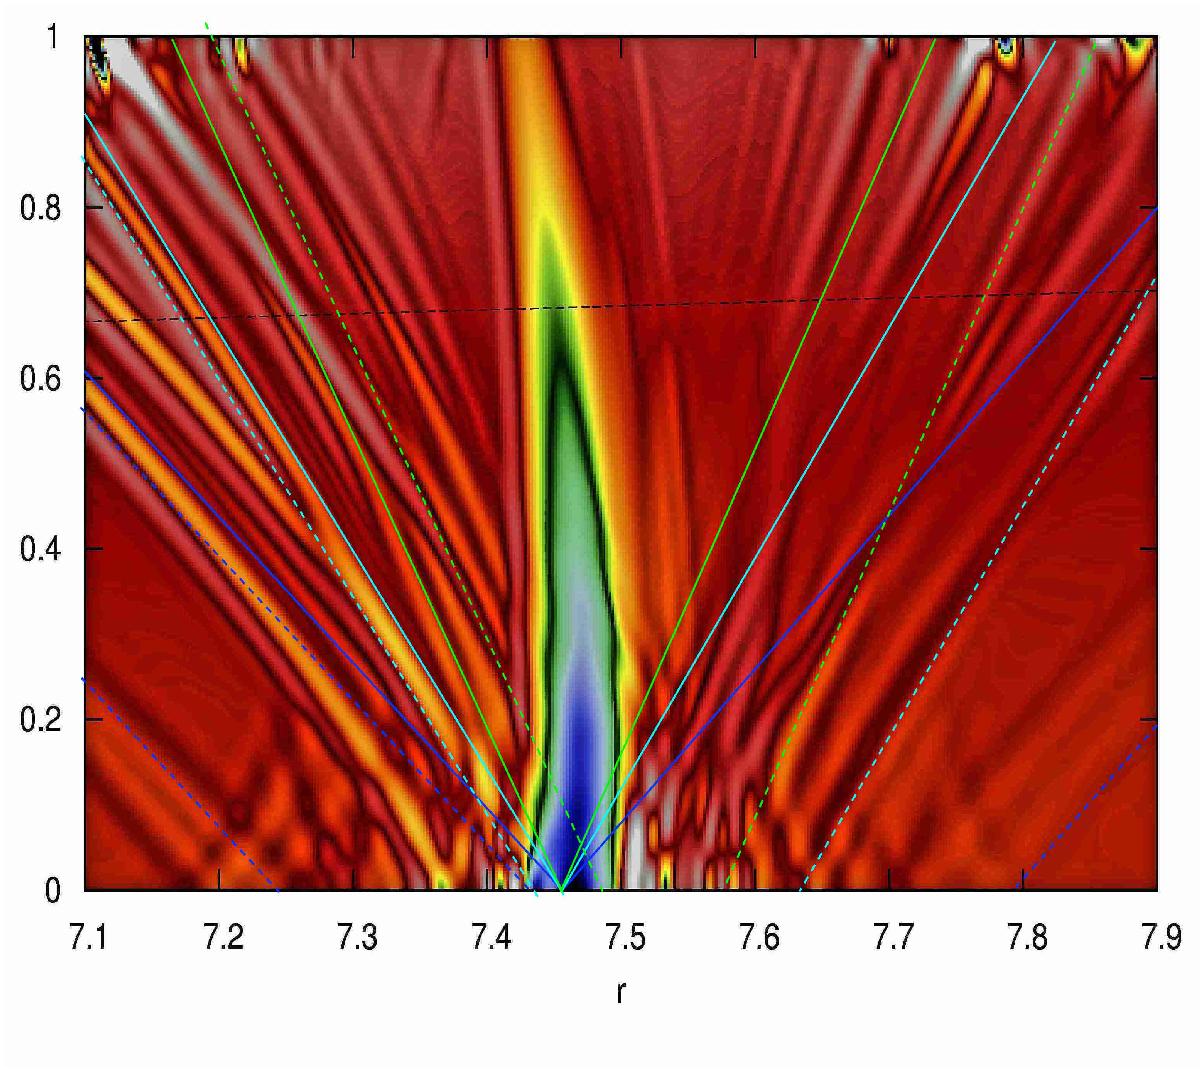
Vorticity map after 445 rotations in a r − z cross section through the strongest vortex (same plot as in Fig. 13 but the contrast has been enhanced to make more salient weak features. The horizontal line (black dashed) indicates the height where ![]() becomes positive. The colored lines (dark-blue, cyan and green) indicate the position of the baroclinic critical layers, as computed from Eq. (26) with a source at the center of the mid-plane vortex for m = 16, 24 and 32, respectively. The dashed-colored lines are other critical layer curves with different positions of the source.
becomes positive. The colored lines (dark-blue, cyan and green) indicate the position of the baroclinic critical layers, as computed from Eq. (26) with a source at the center of the mid-plane vortex for m = 16, 24 and 32, respectively. The dashed-colored lines are other critical layer curves with different positions of the source.
Current usage metrics show cumulative count of Article Views (full-text article views including HTML views, PDF and ePub downloads, according to the available data) and Abstracts Views on Vision4Press platform.
Data correspond to usage on the plateform after 2015. The current usage metrics is available 48-96 hours after online publication and is updated daily on week days.
Initial download of the metrics may take a while.