Free Access
Fig. 4
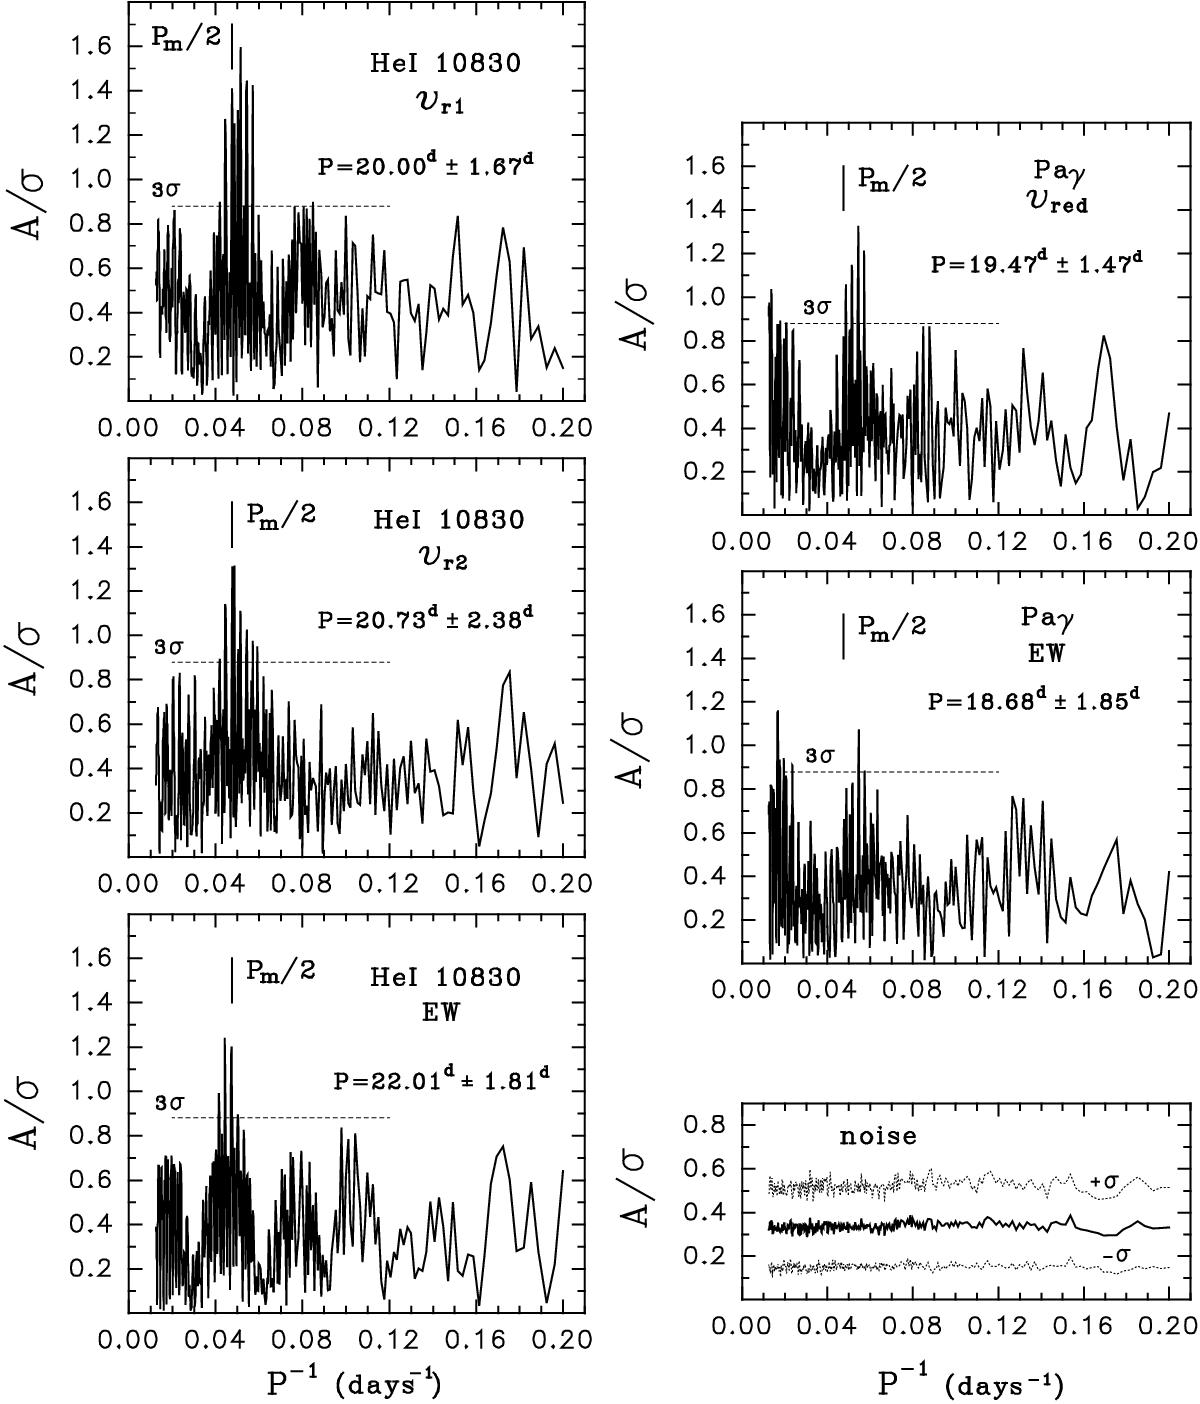
Different line parameters’ A/σ periodograms as defined in Sect. 3. Significance levels of 3σ are indicated by the dashed lines. Short vertical lines indicate the value corresponding to half of the magnetic rotation period (![]() ). The detected period values and their errors are given in each plot.
). The detected period values and their errors are given in each plot.
This figure is made of several images, please see below:
Current usage metrics show cumulative count of Article Views (full-text article views including HTML views, PDF and ePub downloads, according to the available data) and Abstracts Views on Vision4Press platform.
Data correspond to usage on the plateform after 2015. The current usage metrics is available 48-96 hours after online publication and is updated daily on week days.
Initial download of the metrics may take a while.