Fig. 10
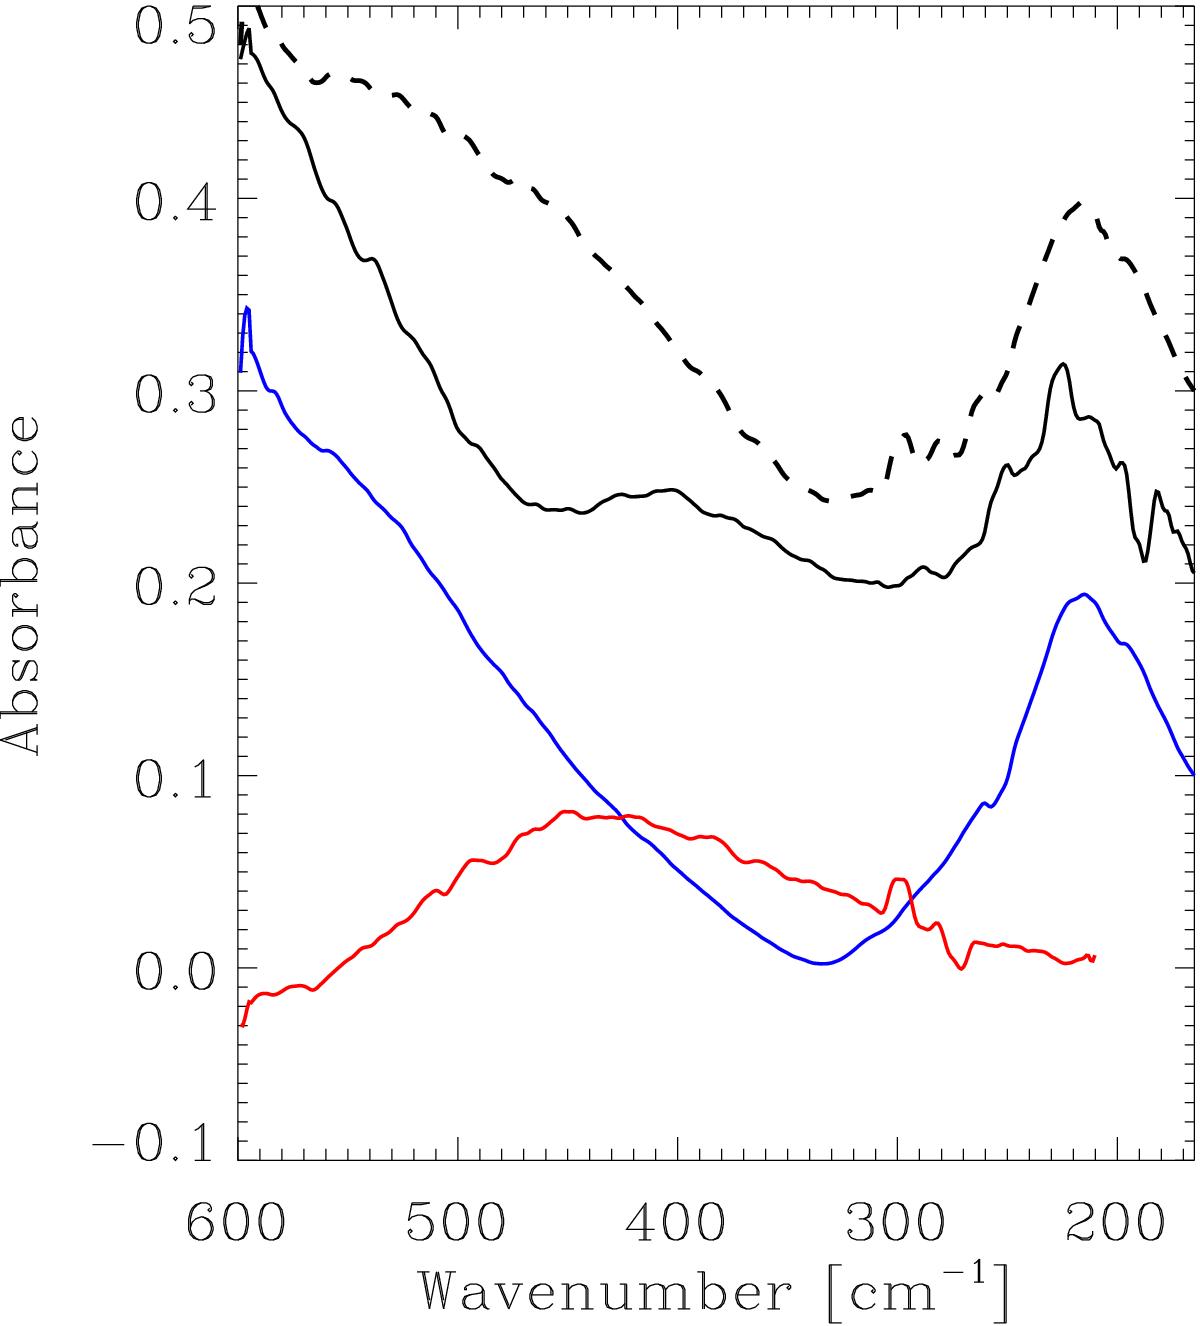
Infrared spectra of an H2O:NH3 3:1 ice mixture in the far-IR region at 8 K (solid line) along with the spectra of pure water (blue solid line) and ammonia (red solid line) ices of the same thicknesses as that of each species in the ice mixture. Pure ice spectra are shifted for clarity. The dashed line represents the sum of the two pure ice spectra.
Current usage metrics show cumulative count of Article Views (full-text article views including HTML views, PDF and ePub downloads, according to the available data) and Abstracts Views on Vision4Press platform.
Data correspond to usage on the plateform after 2015. The current usage metrics is available 48-96 hours after online publication and is updated daily on week days.
Initial download of the metrics may take a while.