Fig. F.1
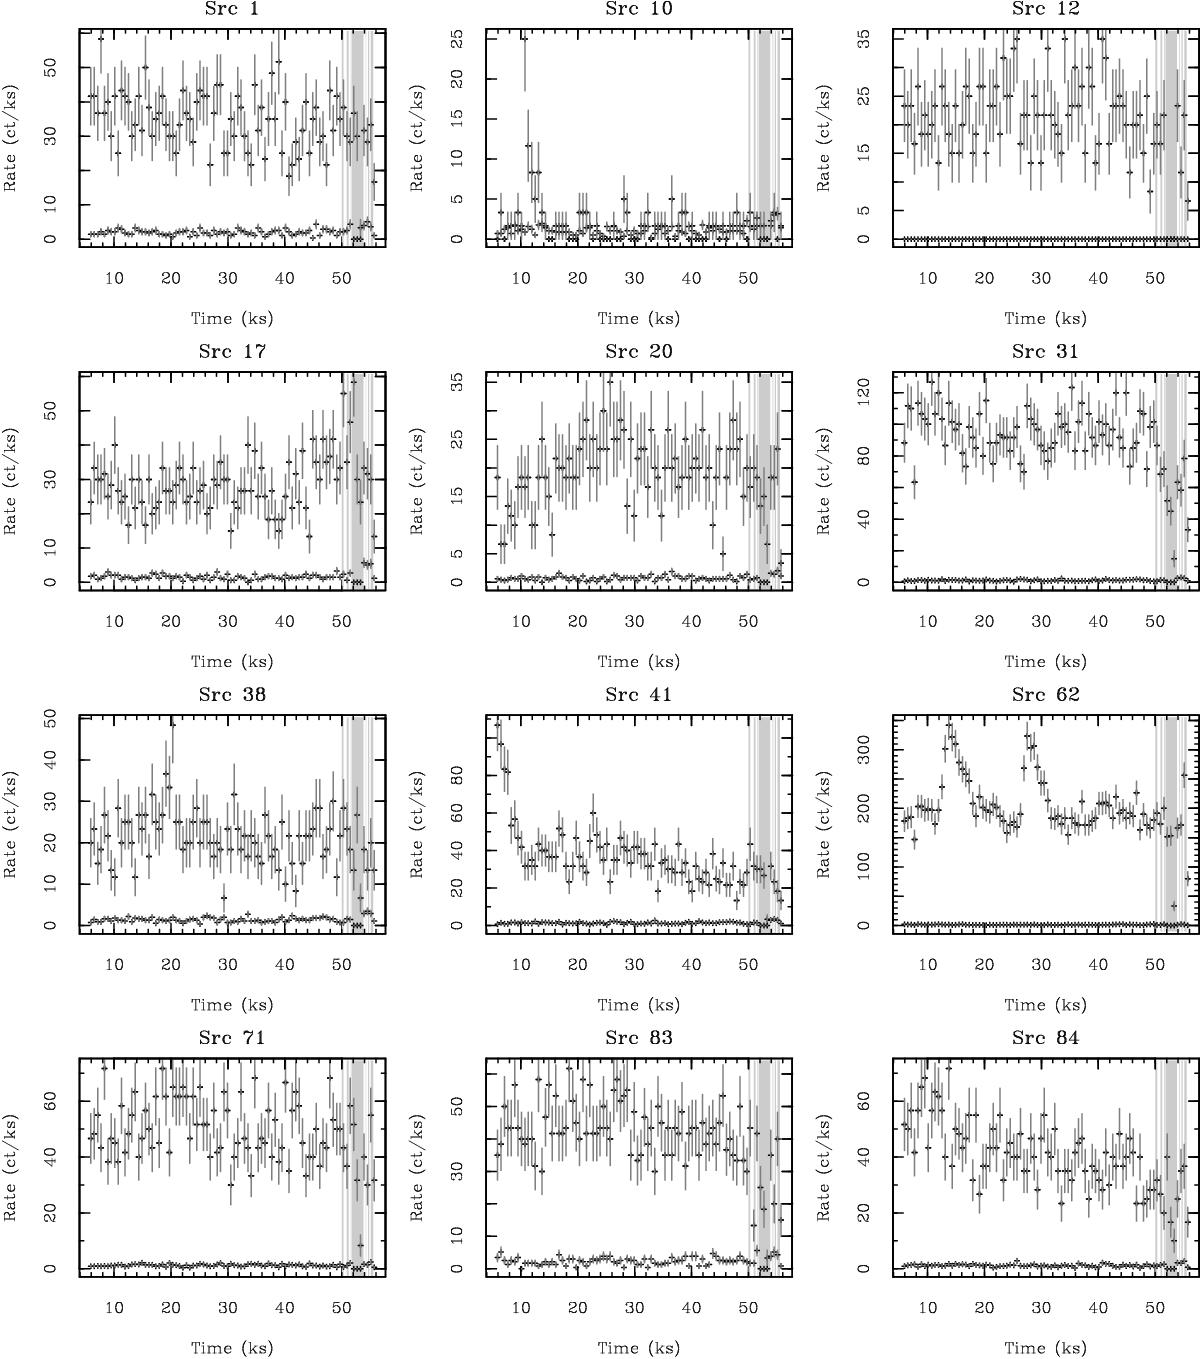
PN light curves of brightest X-ray sources andshowing variability at >1σ level. Light curves of scaled background are also shown. Sources 10, 38, 41 and 62 show clear flare-like variability. Gray areas represent the high background intervals filtered out for optimizing the source detection effectiveness toward faint sources. Source 62 (ρ Ophiuchi C) is discussed in details in Sect. refrhoophC. The light curve of source 50 (ρ Ophiuchi A+B) is not shown here, its analysis is detailed in Pillitteri et al. (2014).
Current usage metrics show cumulative count of Article Views (full-text article views including HTML views, PDF and ePub downloads, according to the available data) and Abstracts Views on Vision4Press platform.
Data correspond to usage on the plateform after 2015. The current usage metrics is available 48-96 hours after online publication and is updated daily on week days.
Initial download of the metrics may take a while.