Fig. 4
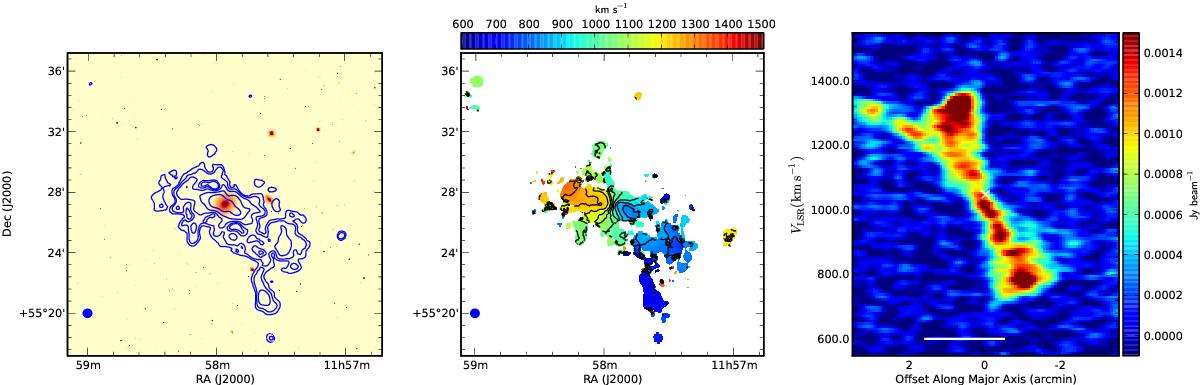
Left: H i column density contours, calculated from the 30′′ cube, overlaid on the r-band SDSS image. The contours are given by SHi = 2n × 1019 cm-2 (n = 0,1,2,...). The beam size is indicated in the lower-left corner of the figure. Middle: intensity-weighted mean velocity field calculated from the 30′′ cube, the iso-velocity contours correspond to Vsys ± n × 50 km s-1, where n = 1,2,3,... and Vsys = 1048 km s-1. Right: position-velocity diagram along the major axis of the 15′′ H i cube. The white scale bar indicates 10 kpc.
Current usage metrics show cumulative count of Article Views (full-text article views including HTML views, PDF and ePub downloads, according to the available data) and Abstracts Views on Vision4Press platform.
Data correspond to usage on the plateform after 2015. The current usage metrics is available 48-96 hours after online publication and is updated daily on week days.
Initial download of the metrics may take a while.