Free Access
Fig. 4
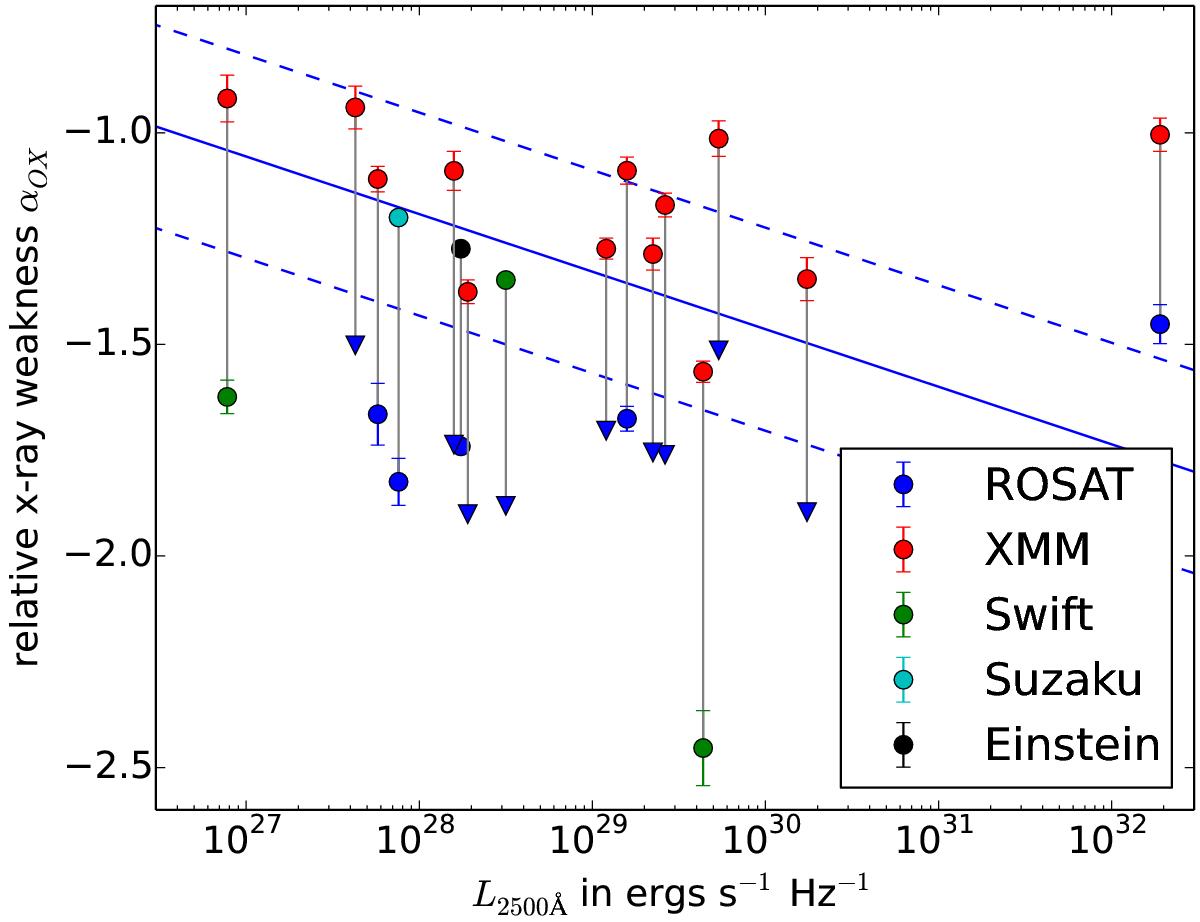
Relative X-ray brightness αOX plotted against luminosity L2500 Å for the high-variability sample. For clarity only the brightest and faintest X-ray observations are shown. L2500 Å is measured from the SED of each source and is assumed to be constant between observations. Triangles represent 95% upper limits.
Current usage metrics show cumulative count of Article Views (full-text article views including HTML views, PDF and ePub downloads, according to the available data) and Abstracts Views on Vision4Press platform.
Data correspond to usage on the plateform after 2015. The current usage metrics is available 48-96 hours after online publication and is updated daily on week days.
Initial download of the metrics may take a while.