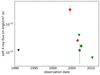
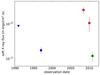
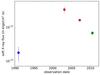
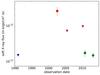
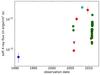
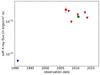
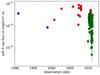
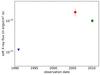
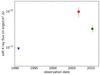
Fig. B.1
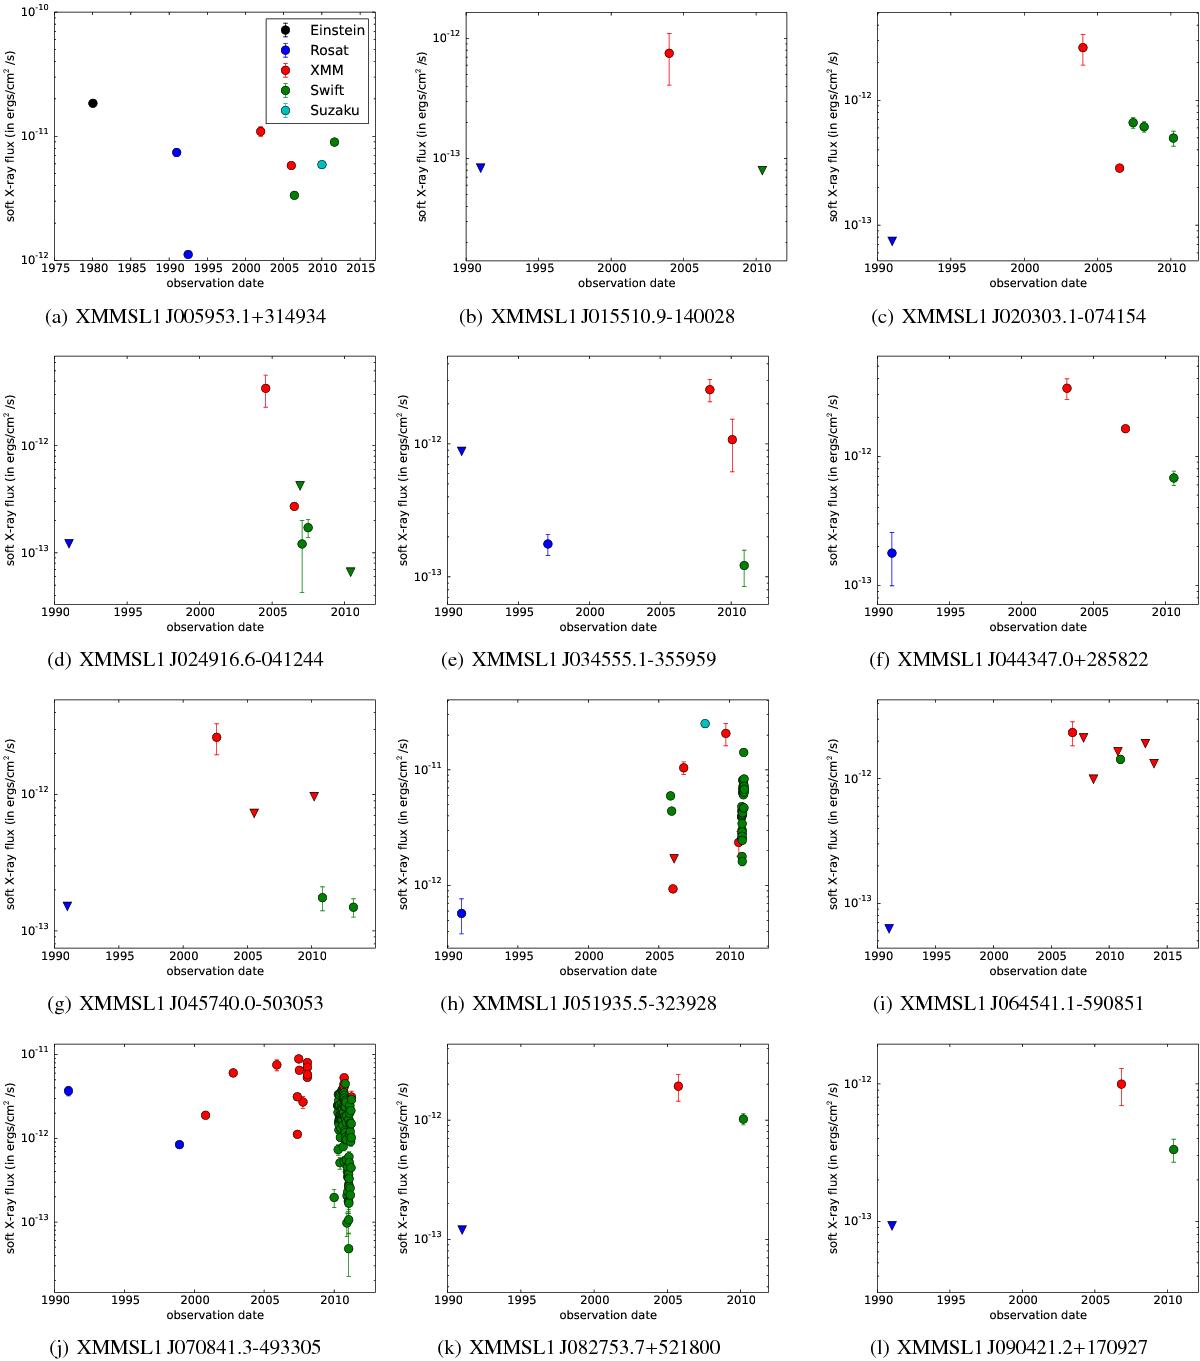
Soft X-ray (0.2–2 keV) light curves for all the sources in our sample. Count rates of the different telescopes were converted to the 0.2–2.0 keV range using PIMMS under the assumption that the spectral shape can be described by a power law with a photon index of 1.7 and absorption in our Galaxy alone. Circles represent detections, while triangles symbolise 95% upper limits on the flux. All error bars are 1σ.
Current usage metrics show cumulative count of Article Views (full-text article views including HTML views, PDF and ePub downloads, according to the available data) and Abstracts Views on Vision4Press platform.
Data correspond to usage on the plateform after 2015. The current usage metrics is available 48-96 hours after online publication and is updated daily on week days.
Initial download of the metrics may take a while.