Fig. 1
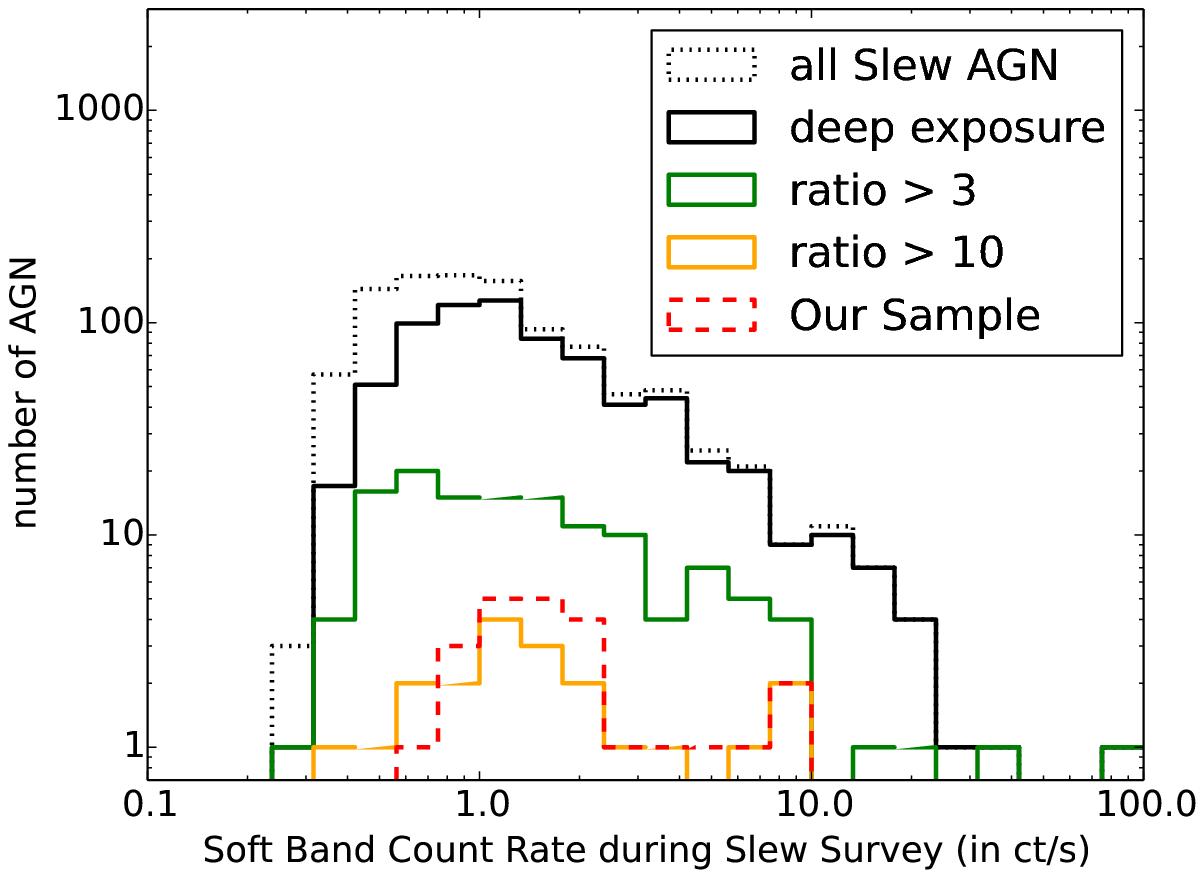
Histogram of XMMSL1 soft-band count rates. The black dashed line shows all detected sources from the Veron sample (see text) while the black solid line corresponds to the fraction of the Veron sample with deep enough ROSAT observations, such that a factor of ten variability in flux between XMMSL1 and ROSAT would have been detected. The green and yellow lines represent sources that fulfil this criterion and that were also observed to vary by a factor of more than three or ten respectively. Our so-called constant sample consists of all sources in-between the black and the green line, while the variable sources are the ones below the red line. Some low-count sources contained within the yellow line have errors on their flux ratios which exclude them from the variable sample and the variable sample includes several AGN which are not in the Veron catalog.
Current usage metrics show cumulative count of Article Views (full-text article views including HTML views, PDF and ePub downloads, according to the available data) and Abstracts Views on Vision4Press platform.
Data correspond to usage on the plateform after 2015. The current usage metrics is available 48-96 hours after online publication and is updated daily on week days.
Initial download of the metrics may take a while.