Free Access
Fig. 10
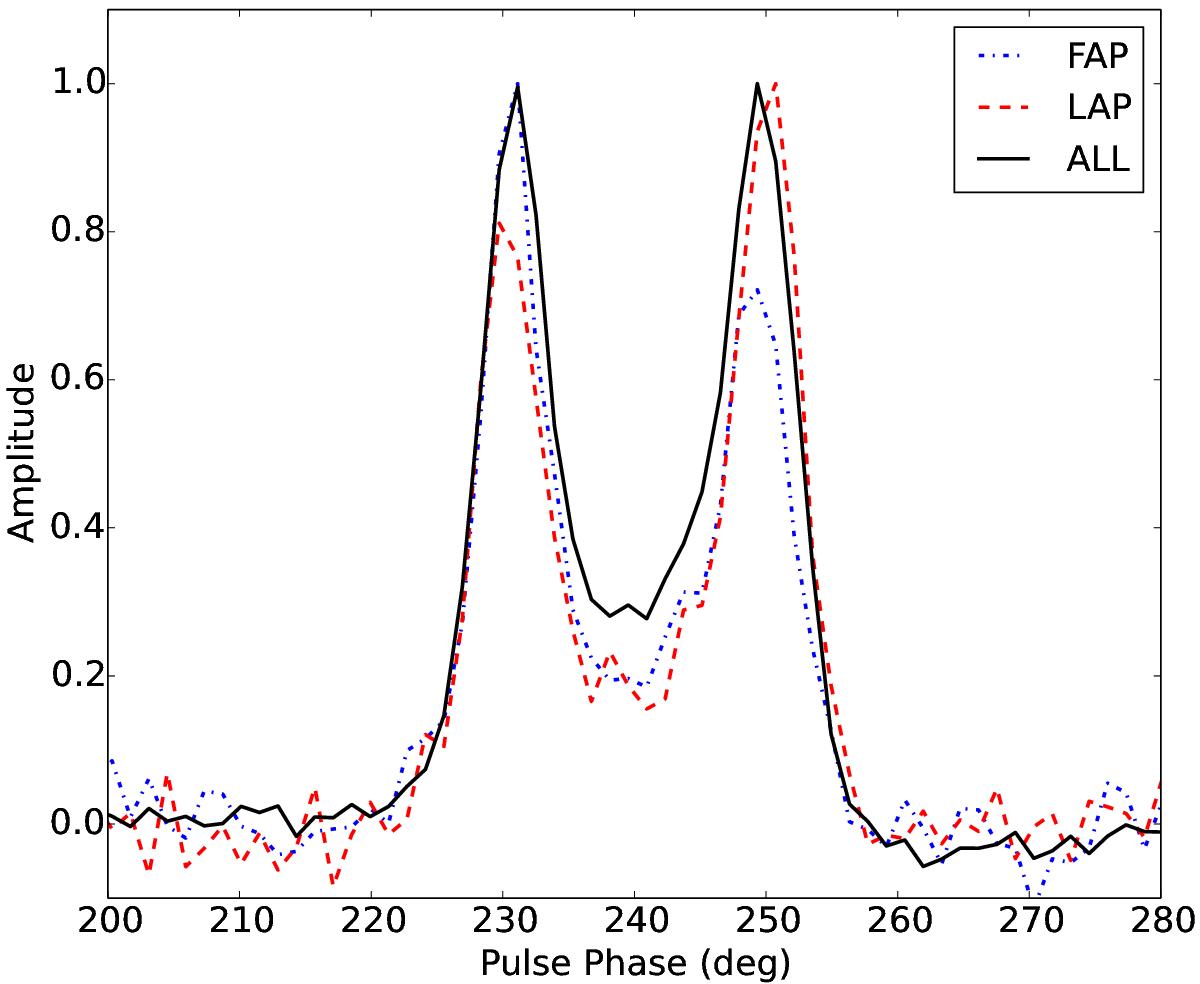
Pulse profiles averaged from the first active pulse (dash-dotted line) and last active pulse (dashed line) of the burst states. The solid line represents the average pulse profile of all pulses. They are normalised by their respective peak intensities for comparison.
Current usage metrics show cumulative count of Article Views (full-text article views including HTML views, PDF and ePub downloads, according to the available data) and Abstracts Views on Vision4Press platform.
Data correspond to usage on the plateform after 2015. The current usage metrics is available 48-96 hours after online publication and is updated daily on week days.
Initial download of the metrics may take a while.