Free Access
Fig. 1
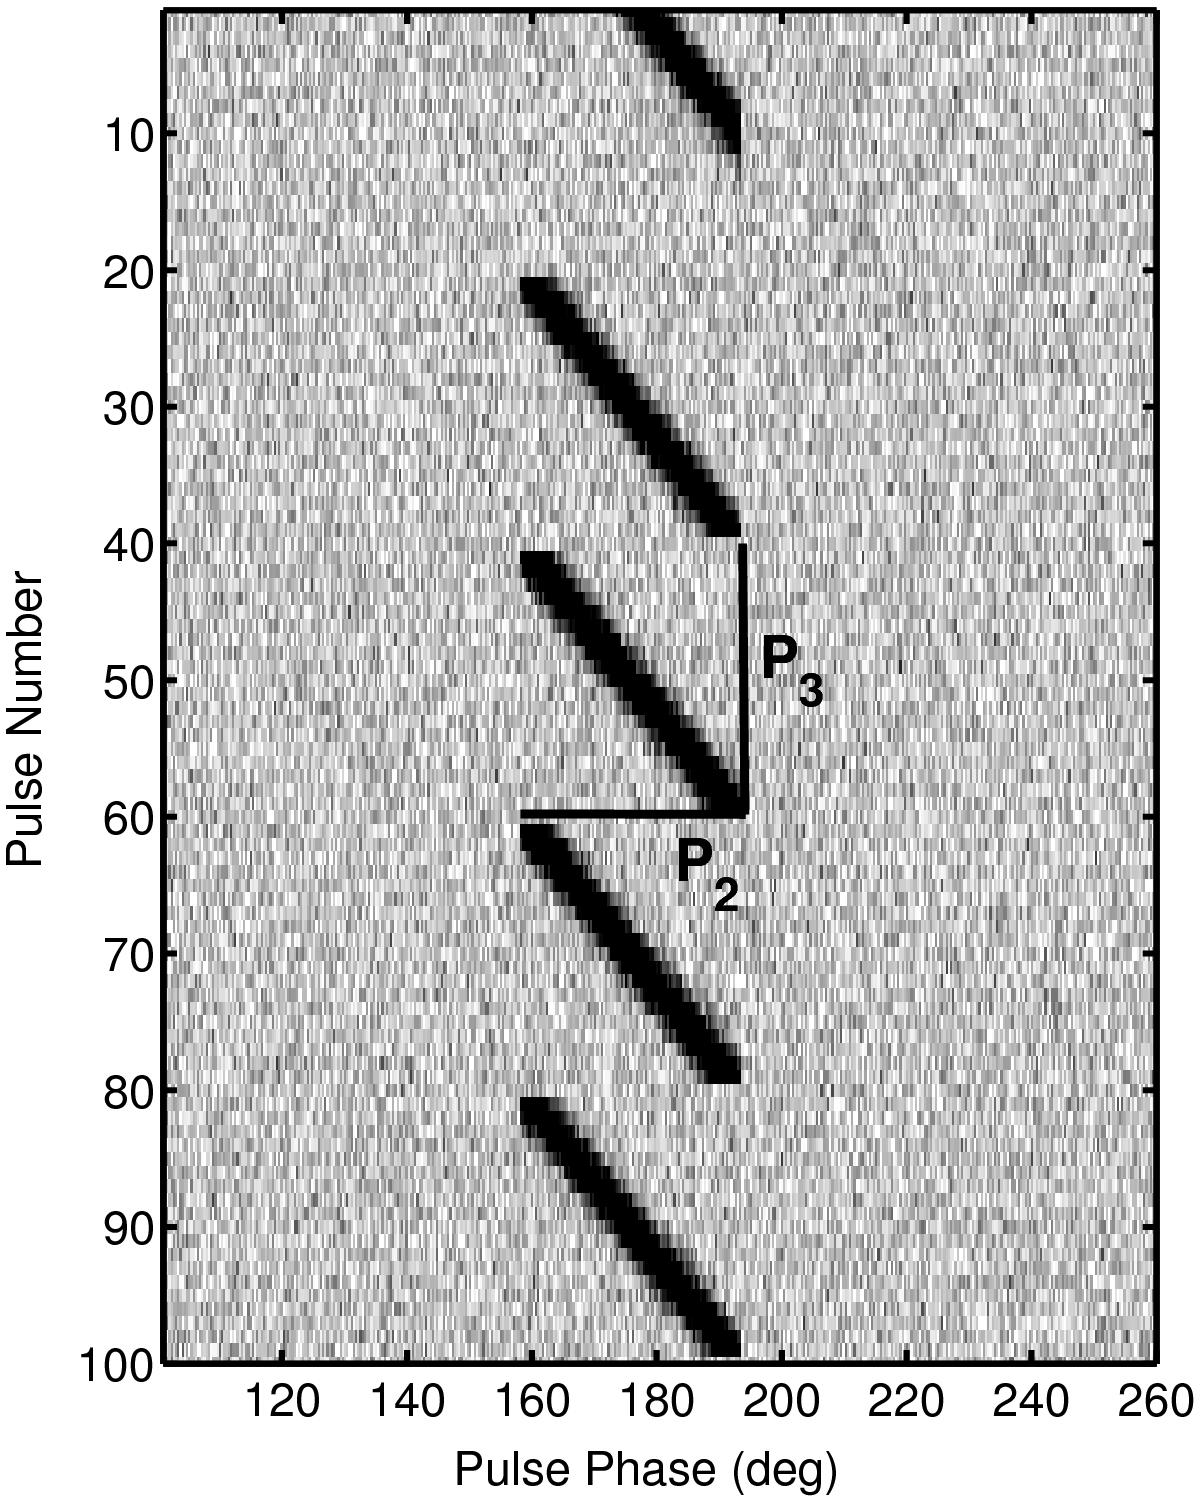
Schematic diagram for a stack of 100 successive pulses of fake data, with pulse phase plotted horizontally and pulse number vertically. P2 and P3 are the separation of successive drift bands horizontally and vertically, respectively.
Current usage metrics show cumulative count of Article Views (full-text article views including HTML views, PDF and ePub downloads, according to the available data) and Abstracts Views on Vision4Press platform.
Data correspond to usage on the plateform after 2015. The current usage metrics is available 48-96 hours after online publication and is updated daily on week days.
Initial download of the metrics may take a while.