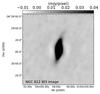
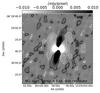
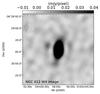
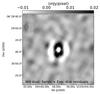
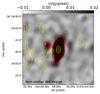
Fig. 8
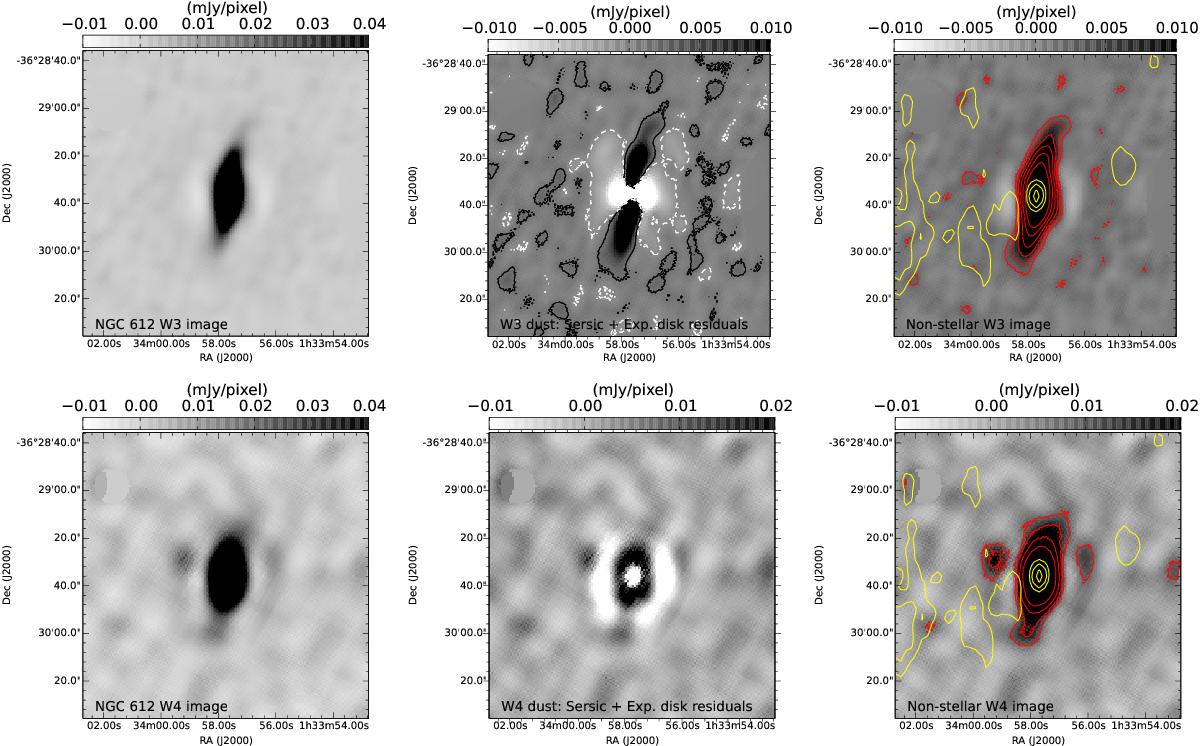
Results of the analysis of the W3 (12 μm) and W4 (22 μm) images of NGC 612. The first row shows the W3 image (left panel), the residuals from the Sérsic + exponential disk model fitting (middle panel), and the image obtained from the scaling method (right panel). The contours in the image of the W3 residuals of NGC 612 (middle row) are ± 1μJy/pixel (positive contour in black, negative one in white). The second row shows the corresponding images for W4. The red contour levels increase by a factor of 2 from 2 to 64 μJy/pixel for the W3 image and from 8 to 64 μJy/pixel for the W4 image. The yellow contours show the radio emission and are the same as in Fig. 1.
Current usage metrics show cumulative count of Article Views (full-text article views including HTML views, PDF and ePub downloads, according to the available data) and Abstracts Views on Vision4Press platform.
Data correspond to usage on the plateform after 2015. The current usage metrics is available 48-96 hours after online publication and is updated daily on week days.
Initial download of the metrics may take a while.