Fig. 3
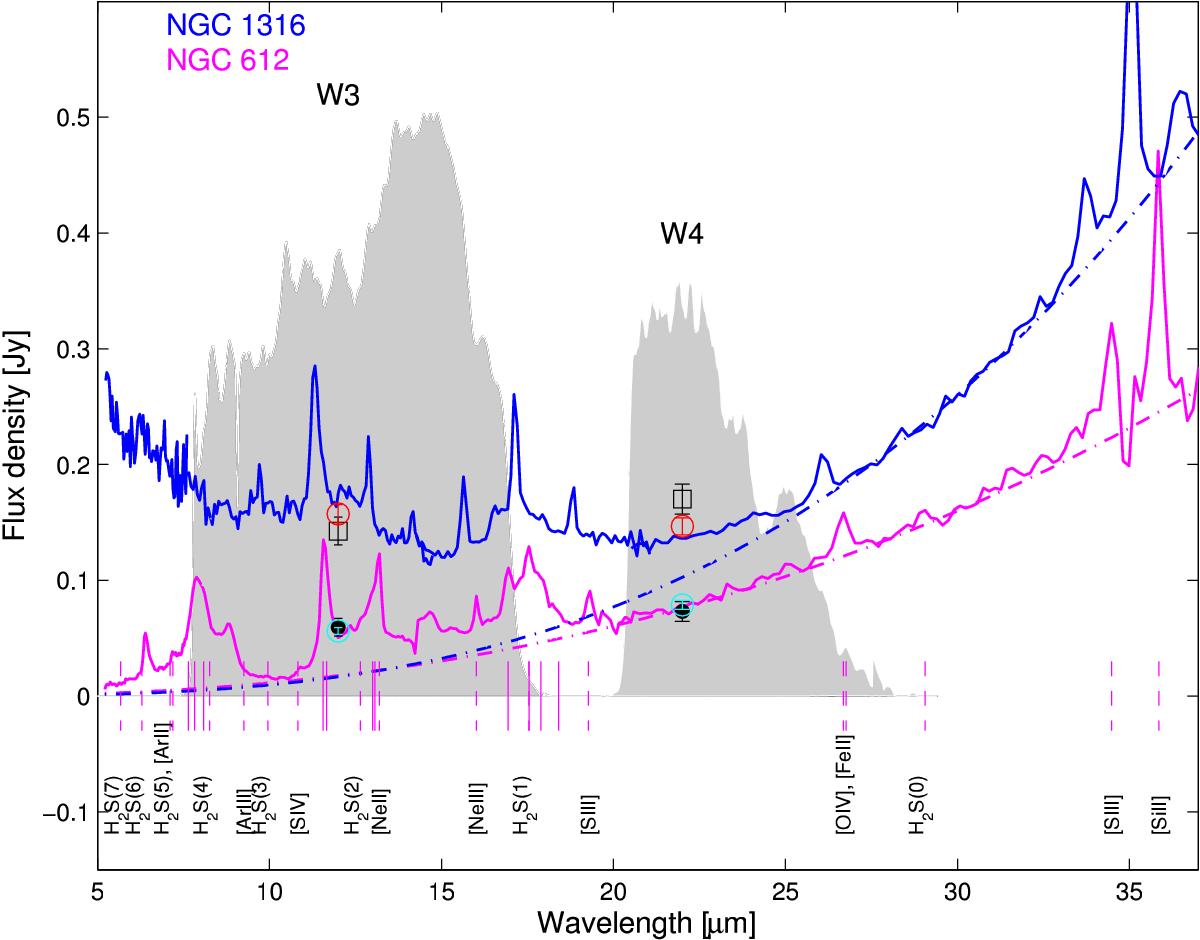
Spitzer IRS spectra of NGC 1316 (in blue) and NGC 612 (in magenta). The spectra differ strongly at short wavelengths, where the Rayleigh-Jeans part of the stellar light is clearly seen for NGC 1316 whereas NGC 612 shows strong emission lines, including from PAHs at 7.7 μm. They also differ at long wavelengths, the NGC 1316 spectrum being significantly steeper than that of NGC 612, as illustrated by the dashed-dotted and the dashed lines which are power-laws with an index of + 3 for NGC 1316 and + 2.4 for NGC 612. Note that those are not formal fits to the data. The response functions of the WISE W3 and W4 bands are shown in grey, in arbitrary units, taking into account the correction by Brown et al. (2014). The WISE fluxes measured in the rectangular regions used to extract the spectra are shown as squares for NGC 1316 and dots for NGC 612. The values obtained by weighing and summing up the Spitzer spectra over the WISE response functions are shown as open circles (red for NGC 1316 and cyan for NGC 612). The vertical lines indicate the wavelengths of the main lines (dashed) and of the PAHs (solid lines) at the redshift of NGC 612.
Current usage metrics show cumulative count of Article Views (full-text article views including HTML views, PDF and ePub downloads, according to the available data) and Abstracts Views on Vision4Press platform.
Data correspond to usage on the plateform after 2015. The current usage metrics is available 48-96 hours after online publication and is updated daily on week days.
Initial download of the metrics may take a while.