Fig. 7
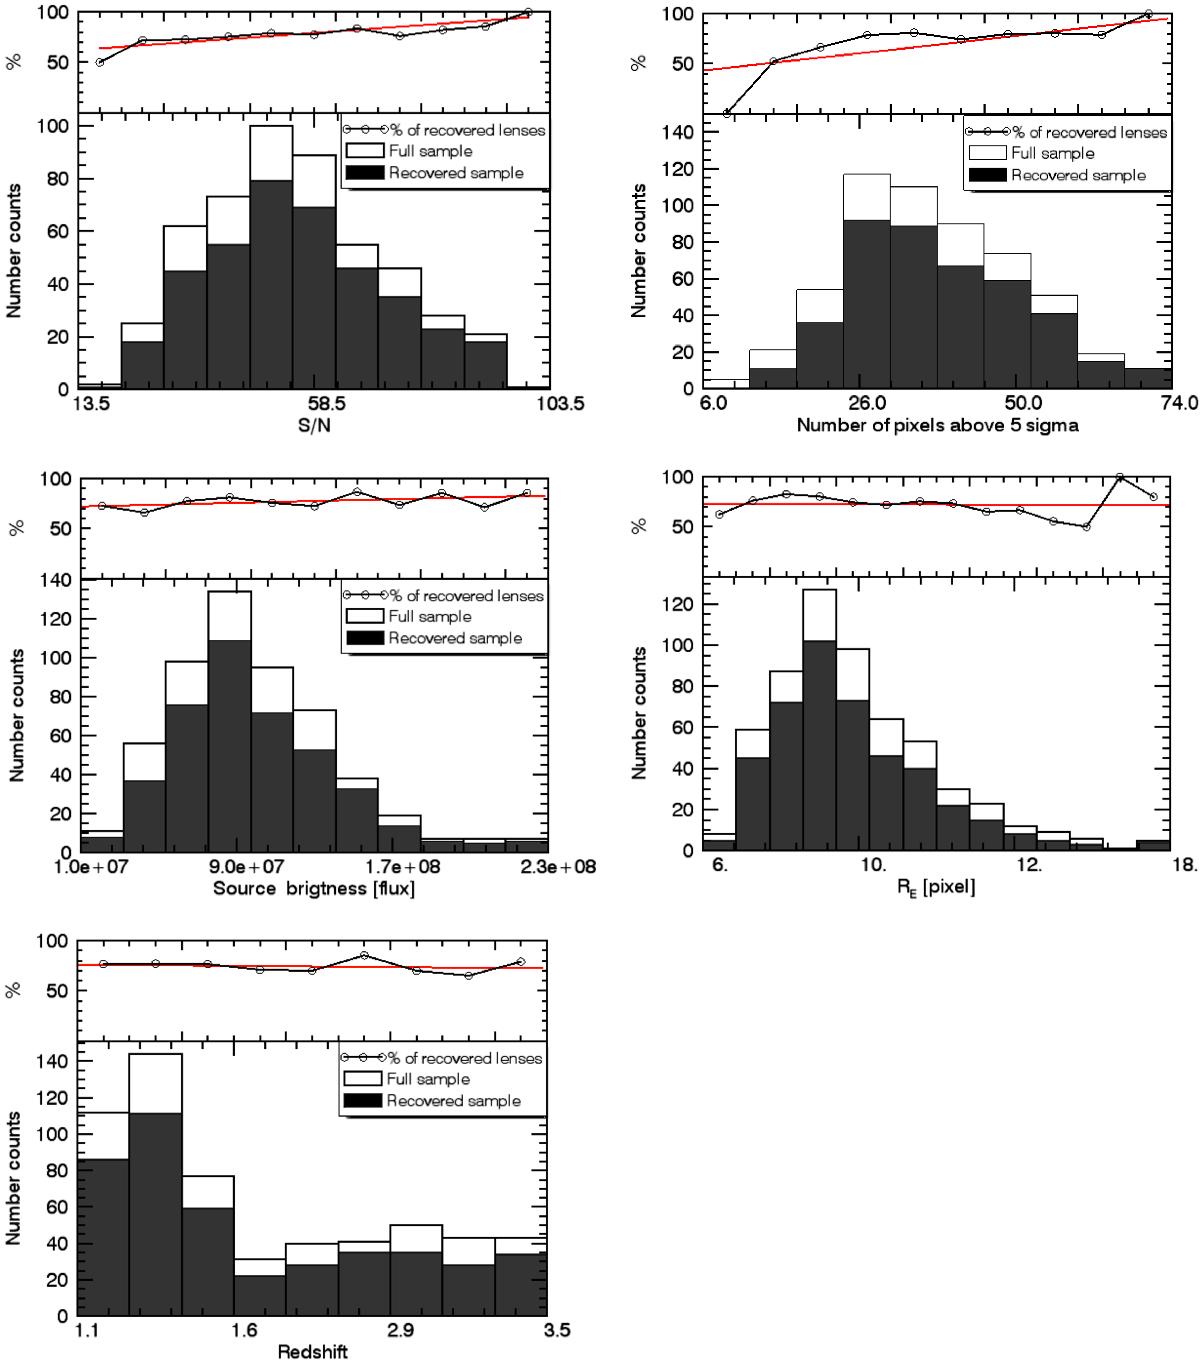
Properties of the lensed systems for the simulated sample. Each plot in the lower panels shows the distributions of selected parameters of the full sample of simulated systems and for the simulated objects we identify as lenses (true positives). The top panels give the ratio of the two, i.e. the completeness per bin of the selected parameter. The red line is a linear regression to guide the eye.

Current usage metrics show cumulative count of Article Views (full-text article views including HTML views, PDF and ePub downloads, according to the available data) and Abstracts Views on Vision4Press platform.
Data correspond to usage on the plateform after 2015. The current usage metrics is available 48-96 hours after online publication and is updated daily on week days.
Initial download of the metrics may take a while.