Fig. 4
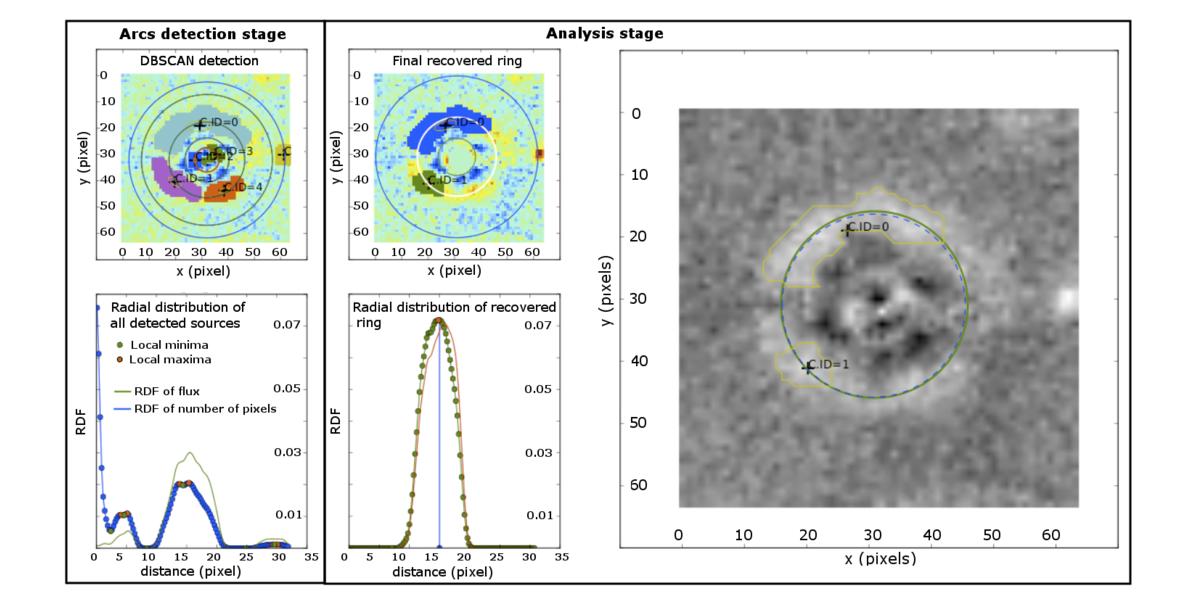
Analysis of the PCA-subtracted images. Arc detection stage. Top panel: DBSCAN detection of the sources. Bottom panel: radial distribution of the detected sources. The green solid line represents the pixel flux radial distribution, while the blue line represents the radial distribution of the number of pixels in the sources. Analysis stage. Top panel: all sources smaller than a critical angular size (e.g. the PSF size) are removed, the remaining sources are merged together in the final ring (indicated with white line). Bottom panel: the red solid line represents the pixel flux radial distribution, while the green line represents the radial distribution of the number of pixels in the sources. Right panel: residual image, where the green solid line shows the best circle fit to the final ring. The yellow lines show the contour of the components of the final ring.
Current usage metrics show cumulative count of Article Views (full-text article views including HTML views, PDF and ePub downloads, according to the available data) and Abstracts Views on Vision4Press platform.
Data correspond to usage on the plateform after 2015. The current usage metrics is available 48-96 hours after online publication and is updated daily on week days.
Initial download of the metrics may take a while.