Fig. 2
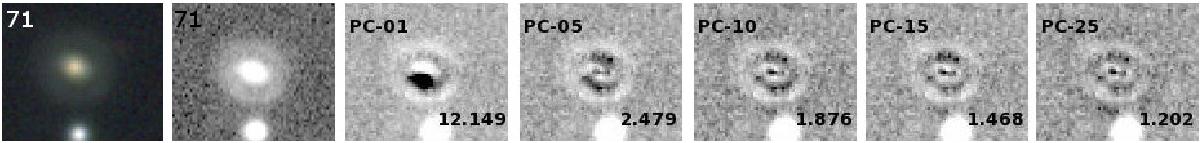
Illustration of the PCA reconstruction of a galaxy image. First two panels: original image (colour and single-band). Each of the other panels: residual image between the data and the reconstructed galaxy using respectively 1, 5, 10, 15 and 25 principal components (PCs). The value of the corresponding reduced χ2 is given in the lower right corner.
Current usage metrics show cumulative count of Article Views (full-text article views including HTML views, PDF and ePub downloads, according to the available data) and Abstracts Views on Vision4Press platform.
Data correspond to usage on the plateform after 2015. The current usage metrics is available 48-96 hours after online publication and is updated daily on week days.
Initial download of the metrics may take a while.