Free Access
Fig. 3
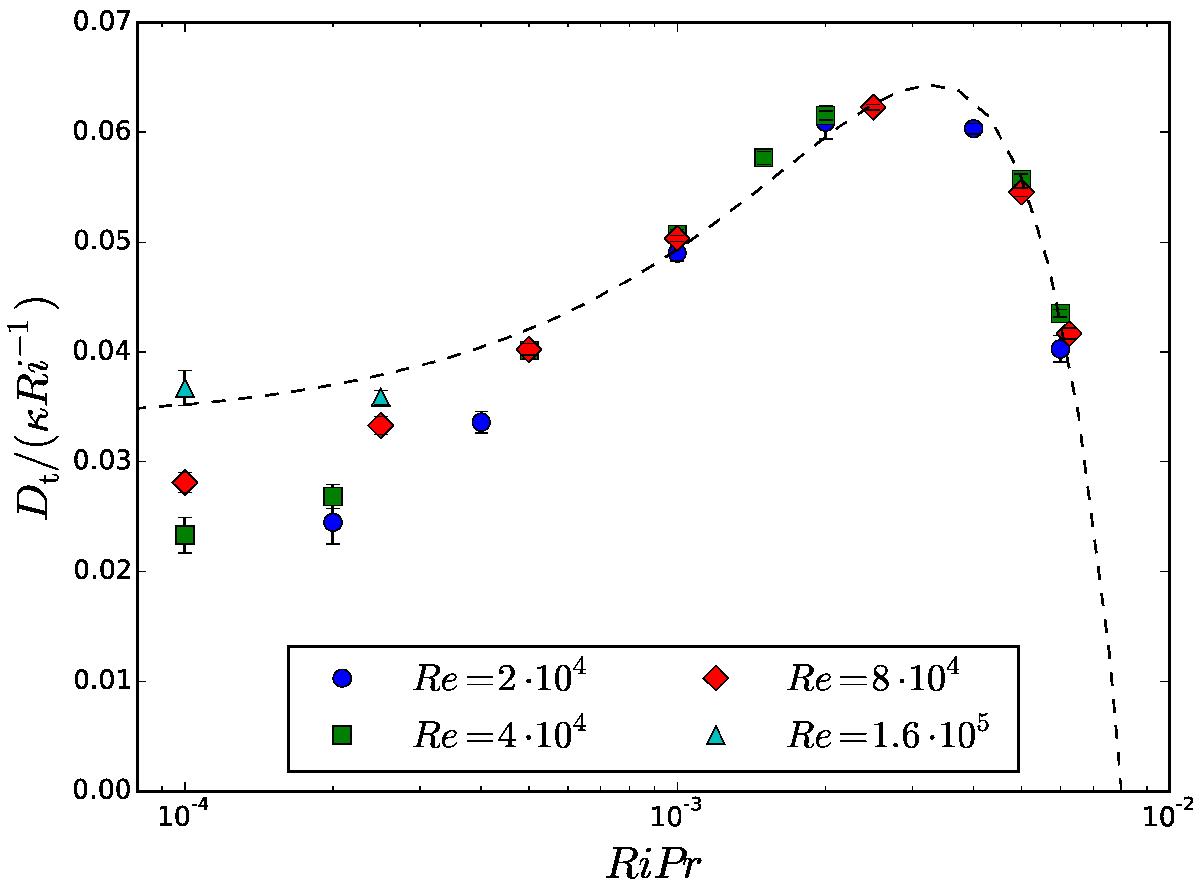
Dt/ (κRi-1) as a function of RiPr obtained with our Snoopy simulations. The dotted line corresponds to the empirical formula given in Eq. (15). There are two overlapping symbols at RiPr = 5 × 10⁻⁴.
Current usage metrics show cumulative count of Article Views (full-text article views including HTML views, PDF and ePub downloads, according to the available data) and Abstracts Views on Vision4Press platform.
Data correspond to usage on the plateform after 2015. The current usage metrics is available 48-96 hours after online publication and is updated daily on week days.
Initial download of the metrics may take a while.