Free Access
Fig. 7
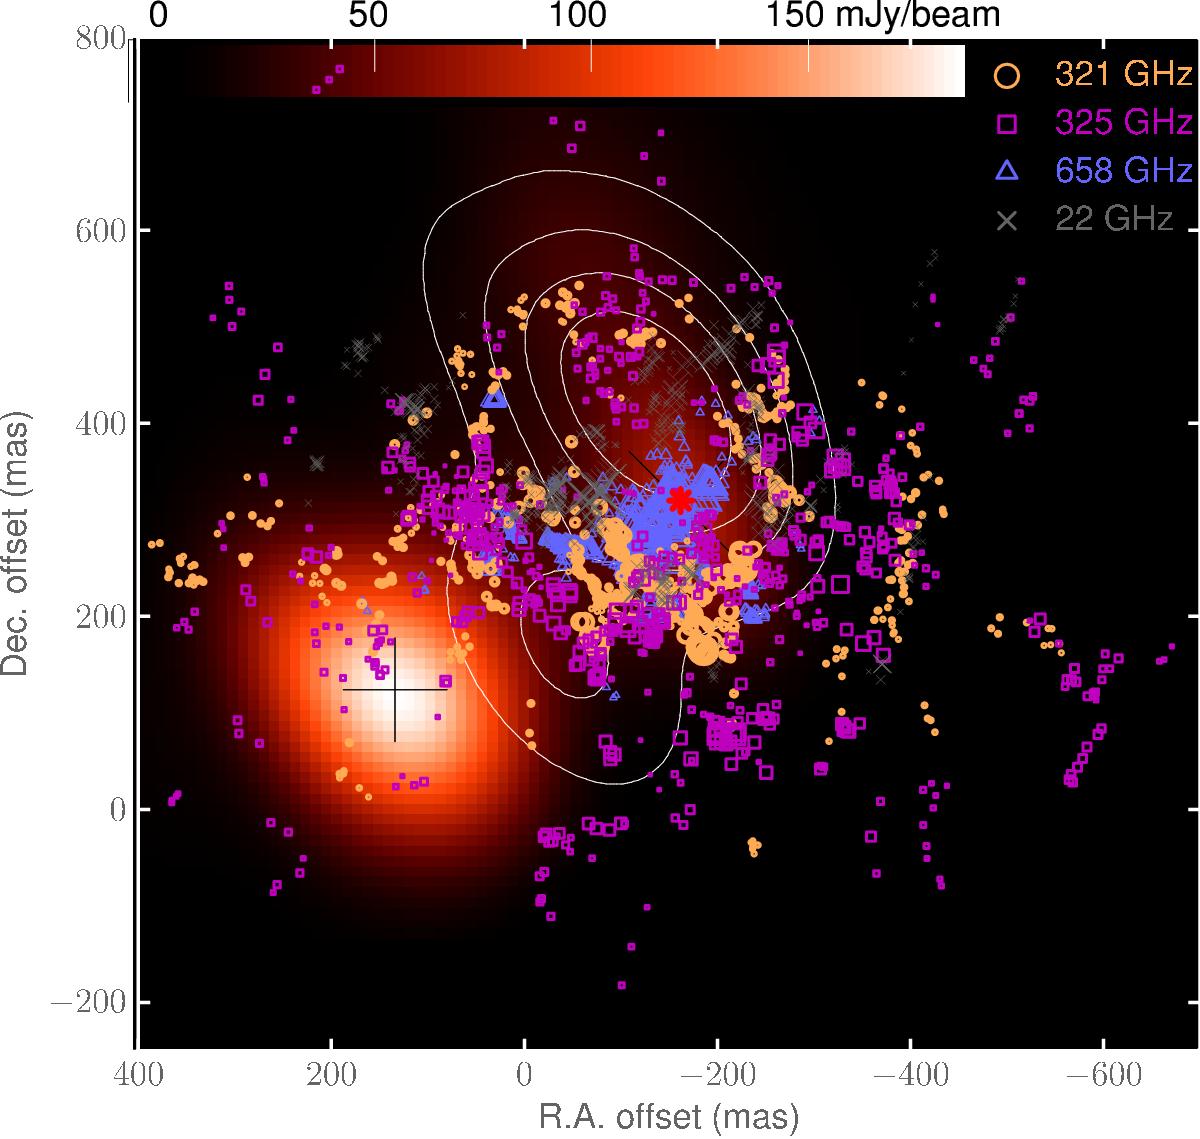
The H2O maser emission (Richards et al. 1998, 2014) is shown on top of the NaCl 312 GHz integrated line emission (gray contours, zeroth moment at 0.25, 0.5, 1, 2, 3, 4 Jy km s-1) and the ALMA dust continuum emission (colour scale; O’Gorman et al. 2015).
Current usage metrics show cumulative count of Article Views (full-text article views including HTML views, PDF and ePub downloads, according to the available data) and Abstracts Views on Vision4Press platform.
Data correspond to usage on the plateform after 2015. The current usage metrics is available 48-96 hours after online publication and is updated daily on week days.
Initial download of the metrics may take a while.