Fig. 2
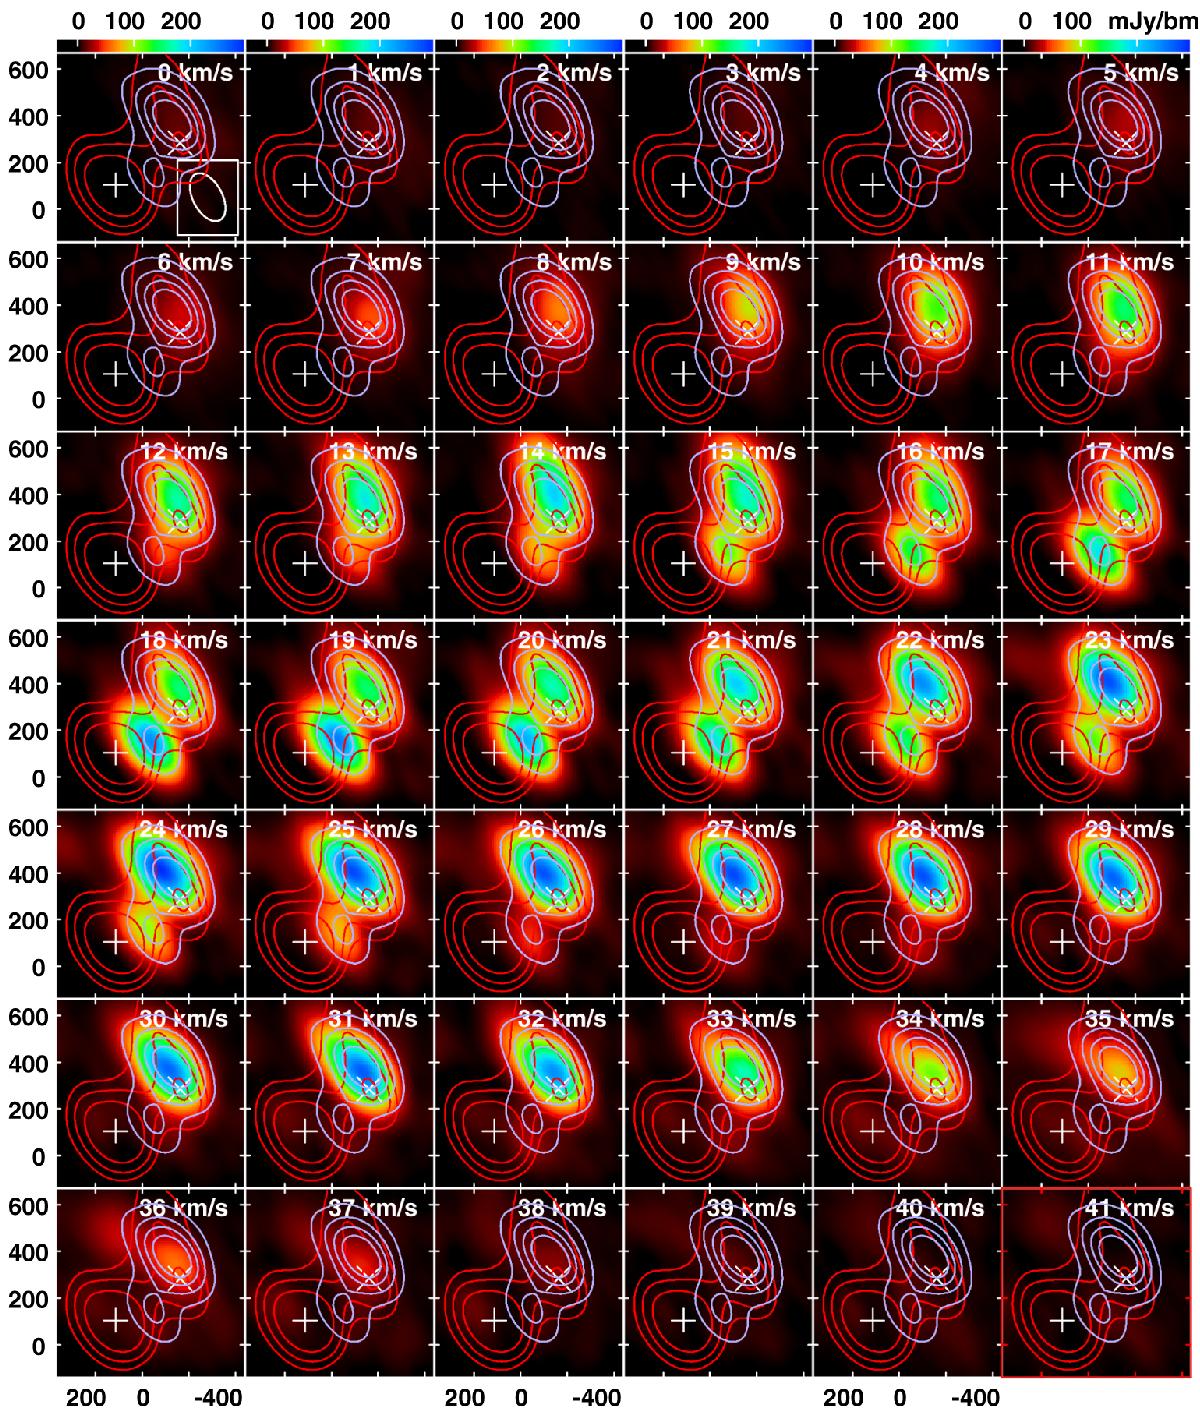
Channel maps (colour scale) of the NaCl v = 0J = 24−23 emission at 312 GHz at a 1 km s-1 velocity resolution for the central 0.̋8 × 0.̋8 field around “VY” and “C”. Grey contours are the integrated NaCl line strength at (1,2,3,4) × 1 Jy/beam km s-1, red contours are the dust continuum measured with ALMA at 321 GHz at (1,2,3,4) × 18 mJy/beam (Richards et al. 2014; O’Gorman et al. 2015). The stellar position “VY” is indicated with a white cross, and the peak of the continuum emission “C” is indicated with a white plus-sign. The ordinate and co-ordinate axis give the offset of the right ascension and declination, respectively, in units of milli-arcseconds.
Current usage metrics show cumulative count of Article Views (full-text article views including HTML views, PDF and ePub downloads, according to the available data) and Abstracts Views on Vision4Press platform.
Data correspond to usage on the plateform after 2015. The current usage metrics is available 48-96 hours after online publication and is updated daily on week days.
Initial download of the metrics may take a while.