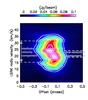
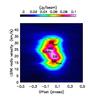
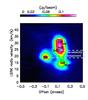
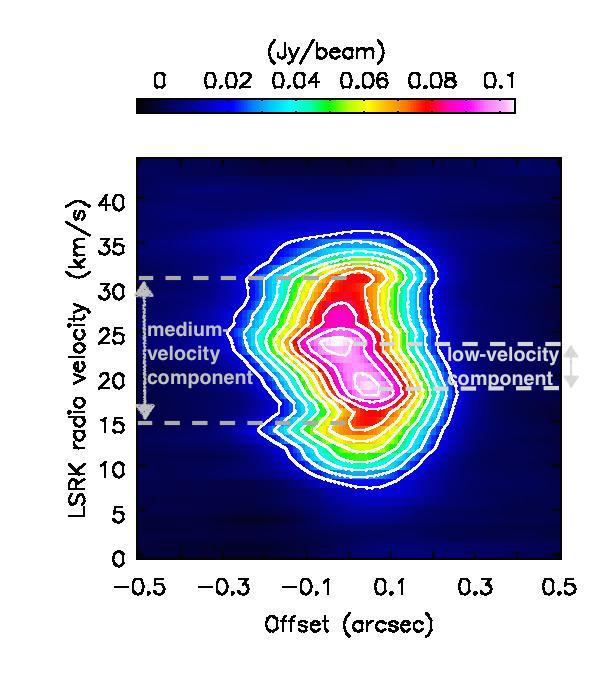
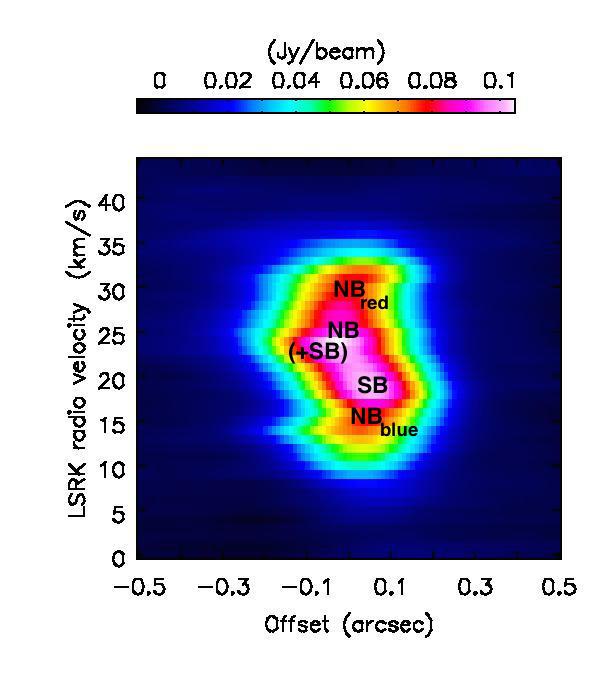
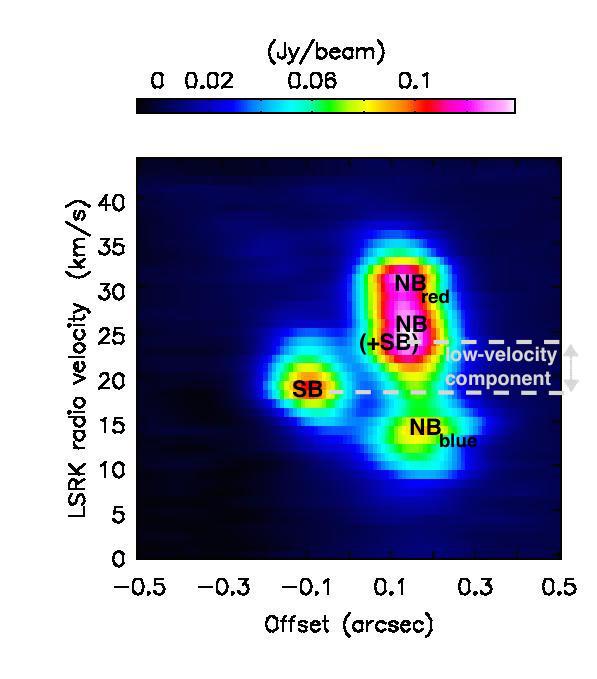
Fig. 10

Position-velocity diagram of the NaCl 312 GHz for an axis length of 1′′ and an averaging width of 650 mas centred at α = 07h22m58.332s and δ = −25°46′03.̋053. In the left and middle panels, the slit has a PA of 50° (i.e. along the presumed polar/rotation axis; with north-east positions having negative offsets and south-west positions positive offsets), in the right panel the slit PA is 140° (i.e. along the presumed equatorial plane; with south-east positions having negative offsets and north-west positions positive offsets). In the left and right panels the different velocity components are indicated, while in the middle and right panels the main contributors to the different intensity peaks are indicated. The contours in the left panel are at [1,2,...10] × 0.01 Jy/beam.
Current usage metrics show cumulative count of Article Views (full-text article views including HTML views, PDF and ePub downloads, according to the available data) and Abstracts Views on Vision4Press platform.
Data correspond to usage on the plateform after 2015. The current usage metrics is available 48-96 hours after online publication and is updated daily on week days.
Initial download of the metrics may take a while.