Free Access
Fig. 1
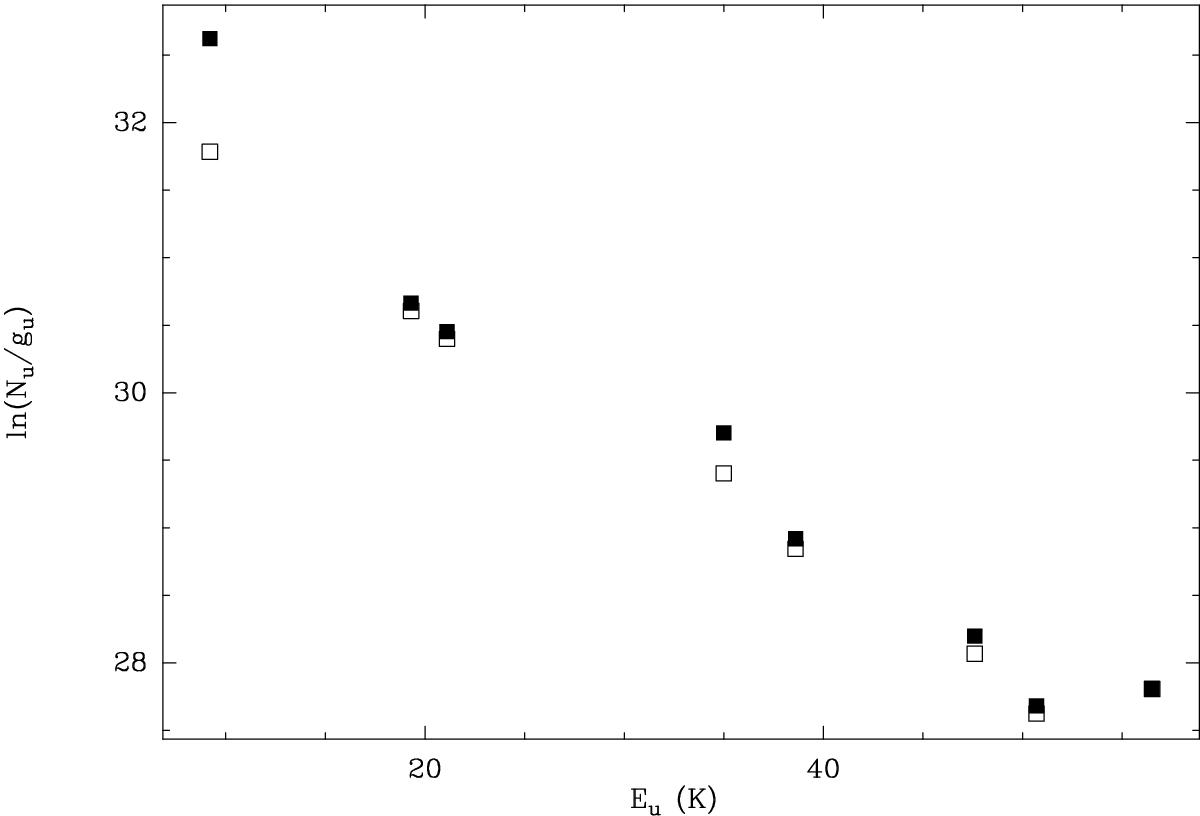
Rotational diagram for SO. Empty squares represent the values for the SO transitions assuming a negligible opacity. Filled squares show the values for Nu/gu corrected for opacity effects.
Current usage metrics show cumulative count of Article Views (full-text article views including HTML views, PDF and ePub downloads, according to the available data) and Abstracts Views on Vision4Press platform.
Data correspond to usage on the plateform after 2015. The current usage metrics is available 48-96 hours after online publication and is updated daily on week days.
Initial download of the metrics may take a while.