Fig. 9
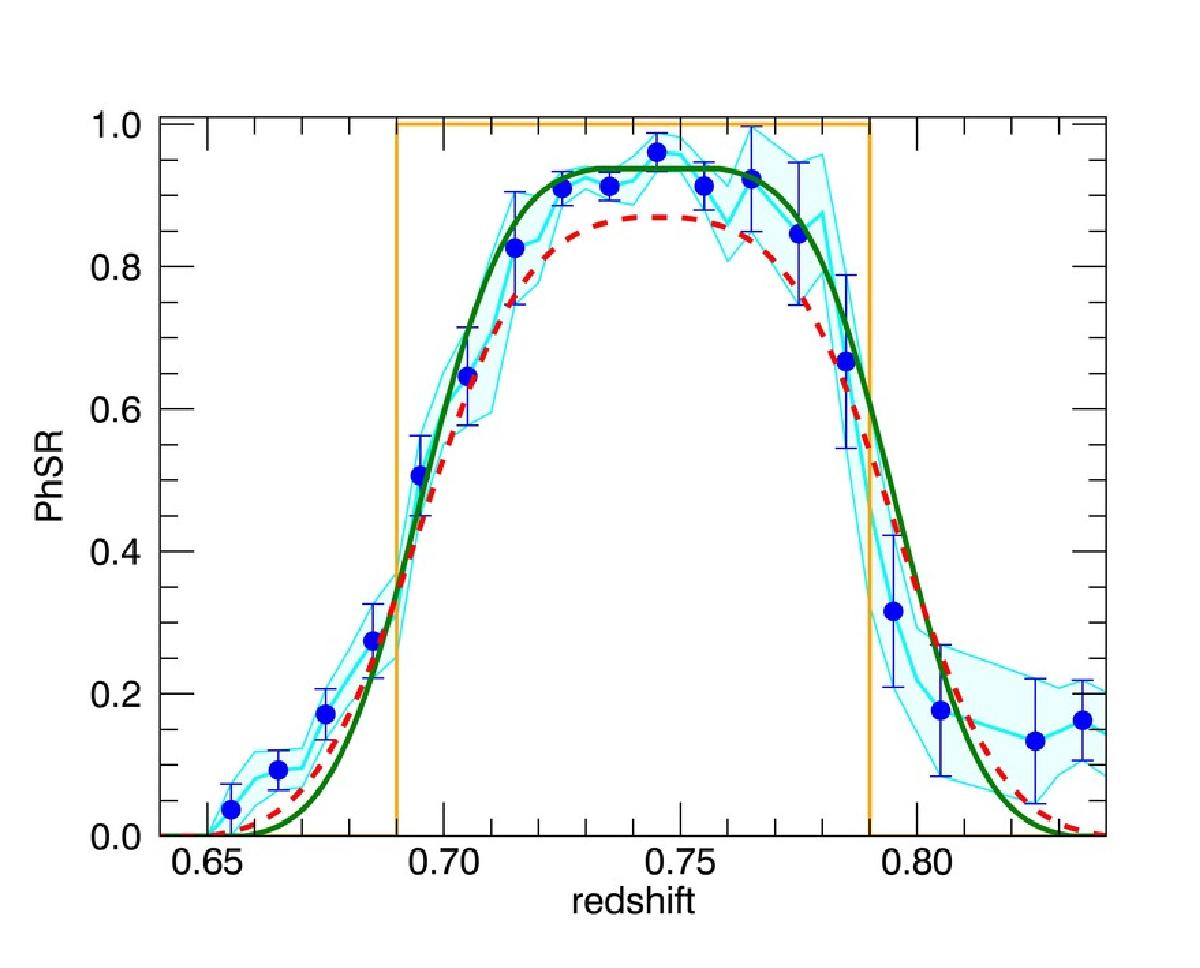
PhSR as a function of redshift. The top hat function plotted in orange is the selection function holding for WPSspec. The shaded area and blue points refer to the observational estimate (using the 20 K-sample) of the success rate of our photometric redshift selection. The continuous green (dashed red) line shows analytical predictions of PhSR for the sample of targets within WPSspec that are brighter (fainter) than IAB = 22.5.
Current usage metrics show cumulative count of Article Views (full-text article views including HTML views, PDF and ePub downloads, according to the available data) and Abstracts Views on Vision4Press platform.
Data correspond to usage on the plateform after 2015. The current usage metrics is available 48-96 hours after online publication and is updated daily on week days.
Initial download of the metrics may take a while.