Fig. 8
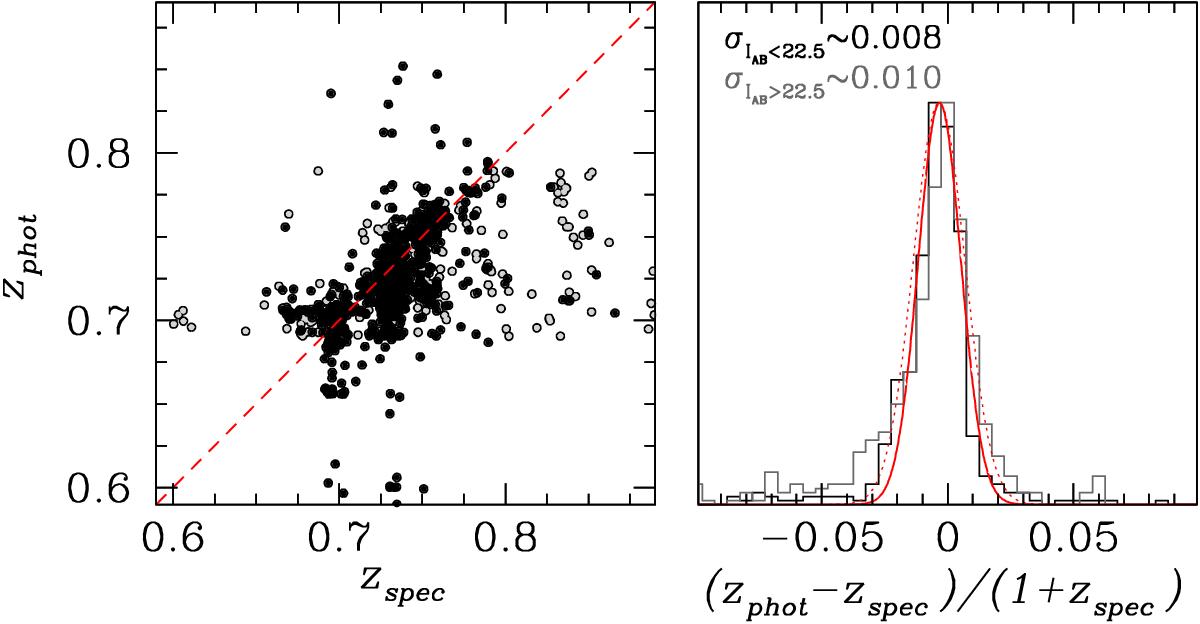
Left panel: zphot vs. zspec for a set of galaxies with zflag ≥ 2, showing the galaxies brighter/fainter than IAB = 22.5 in black/gray. Right panel: histogram of (zphot−zspec) / (1 + zspec) for the same set of galaxies and its Gaussian fit. The black/gray histogram refers to galaxies that are brighter/fainter than IAB = 22.5, while the continuous/dotted red line shows the Gaussian fit to the histogram of the brighter/fainter galaxies. The labels indicate the value of σ for each Gaussian.
Current usage metrics show cumulative count of Article Views (full-text article views including HTML views, PDF and ePub downloads, according to the available data) and Abstracts Views on Vision4Press platform.
Data correspond to usage on the plateform after 2015. The current usage metrics is available 48-96 hours after online publication and is updated daily on week days.
Initial download of the metrics may take a while.