Fig. 7
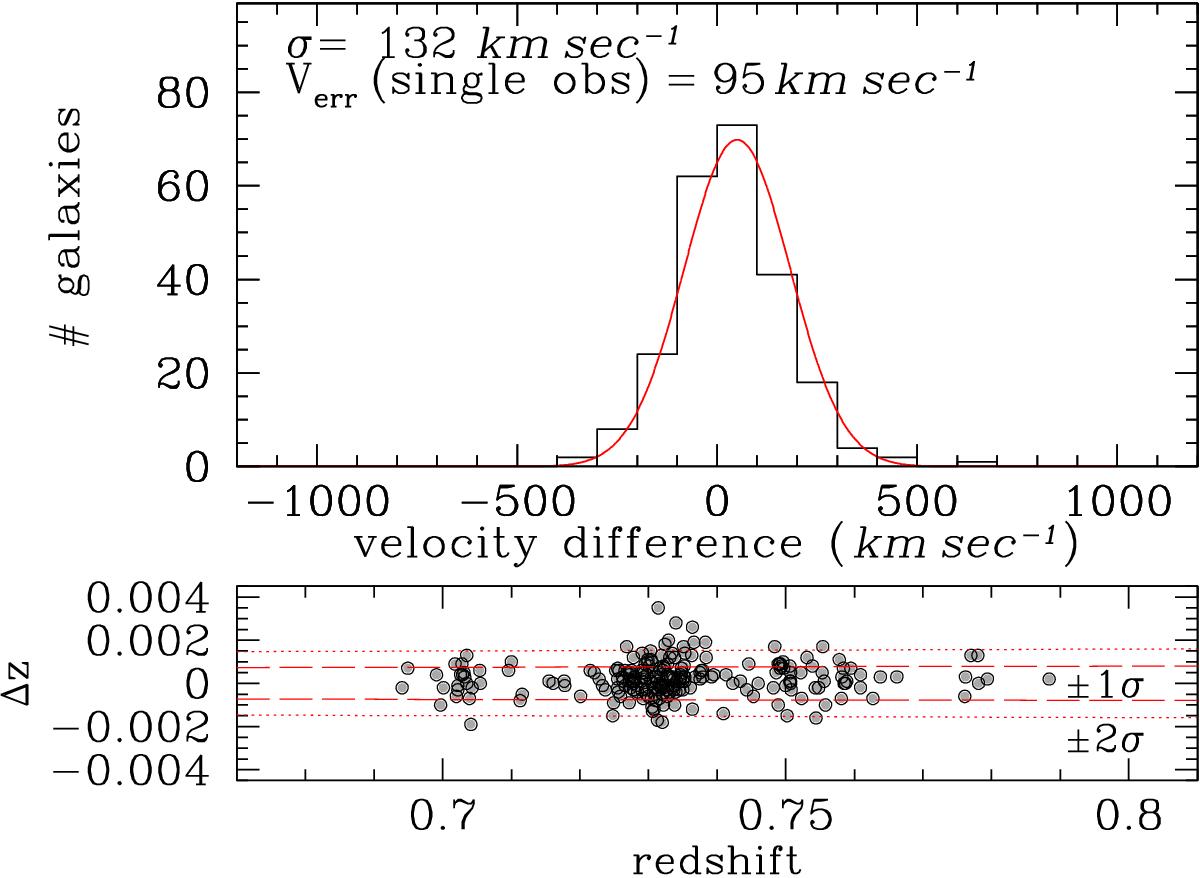
Our accuracy in the redshift measurements. Top panel: histogram of the distribution of velocity differences Δv = c × Δz/ (1 + z) for the set of 237 galaxies from the WPSspec that were observed twice and whose redshift was independently measured. Such histogram is well fitted by a Gaussian of width σ = 132 km s-1. Lower panel: redshift differences; the dashed (dotted) line corresponds to ±1(2)σ redshift difference.
Current usage metrics show cumulative count of Article Views (full-text article views including HTML views, PDF and ePub downloads, according to the available data) and Abstracts Views on Vision4Press platform.
Data correspond to usage on the plateform after 2015. The current usage metrics is available 48-96 hours after online publication and is updated daily on week days.
Initial download of the metrics may take a while.