Free Access
Fig. 6
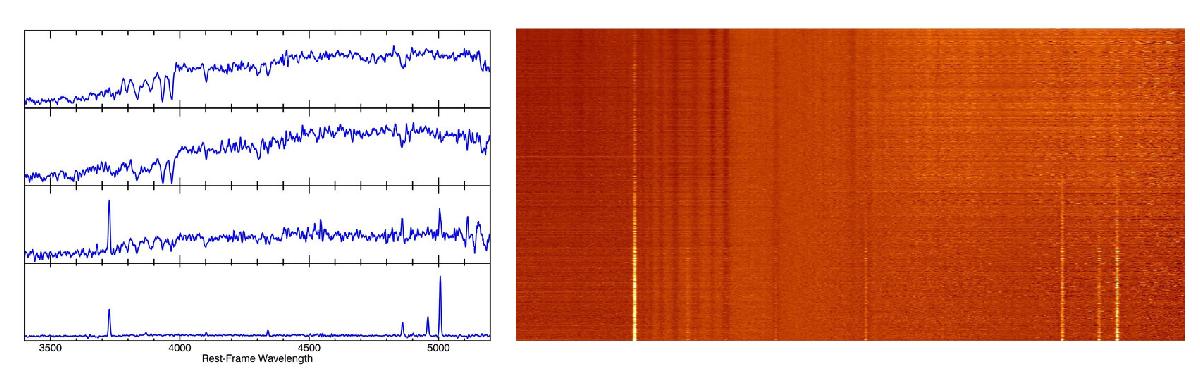
Left panel: examples of our typical spectra, plotted using rest-frame and rebinned to 2 Å pixel-1. Right panel: montage of all our rest-frame spectra using the same wavelength range as for the left panel, with galaxy stellar mass decreasing from top to bottom.
Current usage metrics show cumulative count of Article Views (full-text article views including HTML views, PDF and ePub downloads, according to the available data) and Abstracts Views on Vision4Press platform.
Data correspond to usage on the plateform after 2015. The current usage metrics is available 48-96 hours after online publication and is updated daily on week days.
Initial download of the metrics may take a while.