Fig. 2
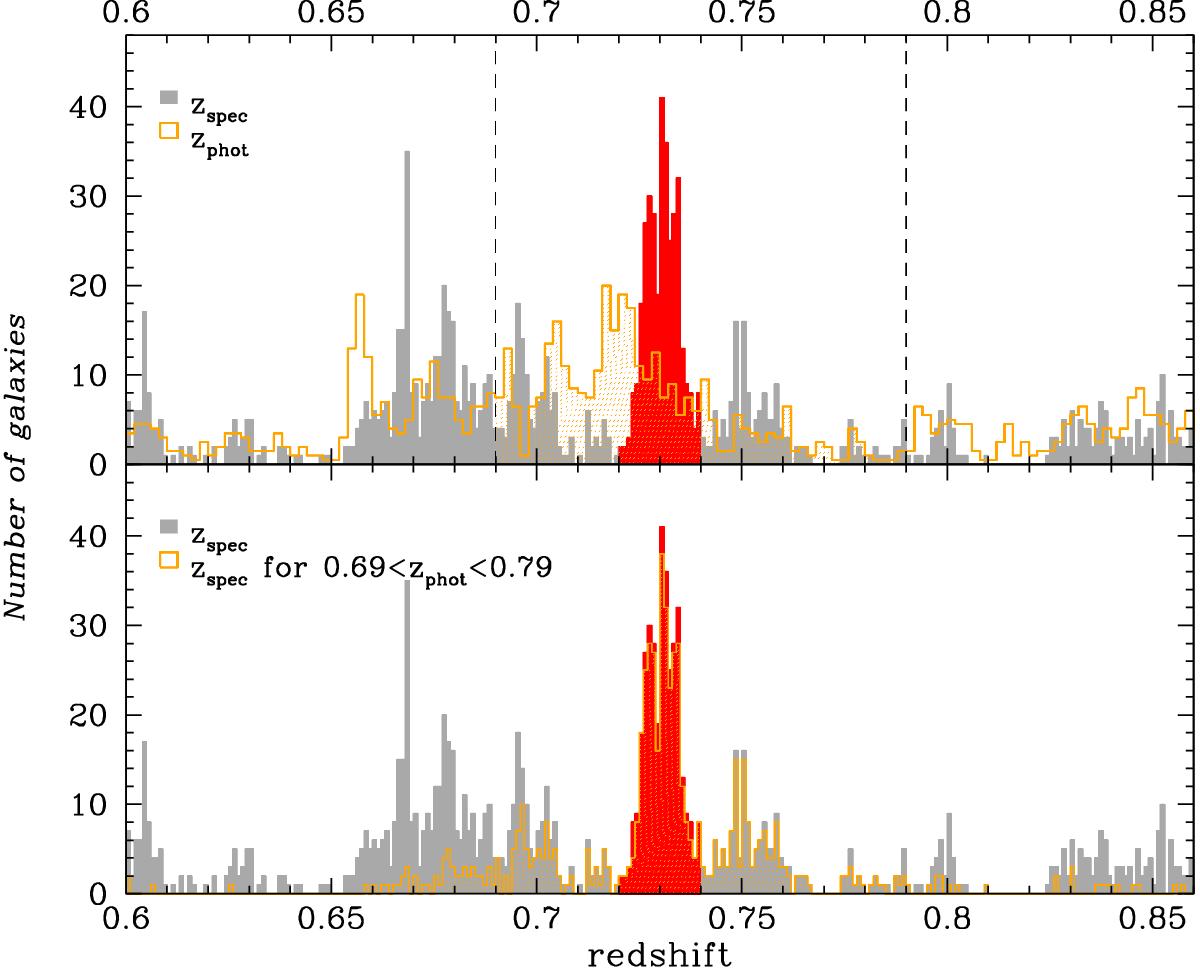
Top panel: redshift histogram of the 20 K-sample within the sky region targeted for observations. In red we highlight the subset of galaxies in the redshift range 0.72 ≤ zspec ≤ 0.74, corresponding to the prominent peak of the COSMOS Wall structure. For comparison the orange histogram shows the photometric redshift distribution of the full 20 K-sample within the same sky region. The Wall volume redshift interval, 0.69 ≤ z ≤ 0.79 (indicated by two dashed lines), includes both the COSMOS Wall structure and two conspicuous lower density regions in the redshift ranges 0.71 ≤ zspec ≤ 0.72 and 0.76 ≤ zspec ≤ 0.77. Bottom panel: same as top panel but with superimposed (in orange) the histogram of the spectroscopic redshift distribution of the galaxies possessing a photometric redshift within the Wall volume: 0.69 ≤ zphot ≤ 0.79.
Current usage metrics show cumulative count of Article Views (full-text article views including HTML views, PDF and ePub downloads, according to the available data) and Abstracts Views on Vision4Press platform.
Data correspond to usage on the plateform after 2015. The current usage metrics is available 48-96 hours after online publication and is updated daily on week days.
Initial download of the metrics may take a while.