Fig. 16
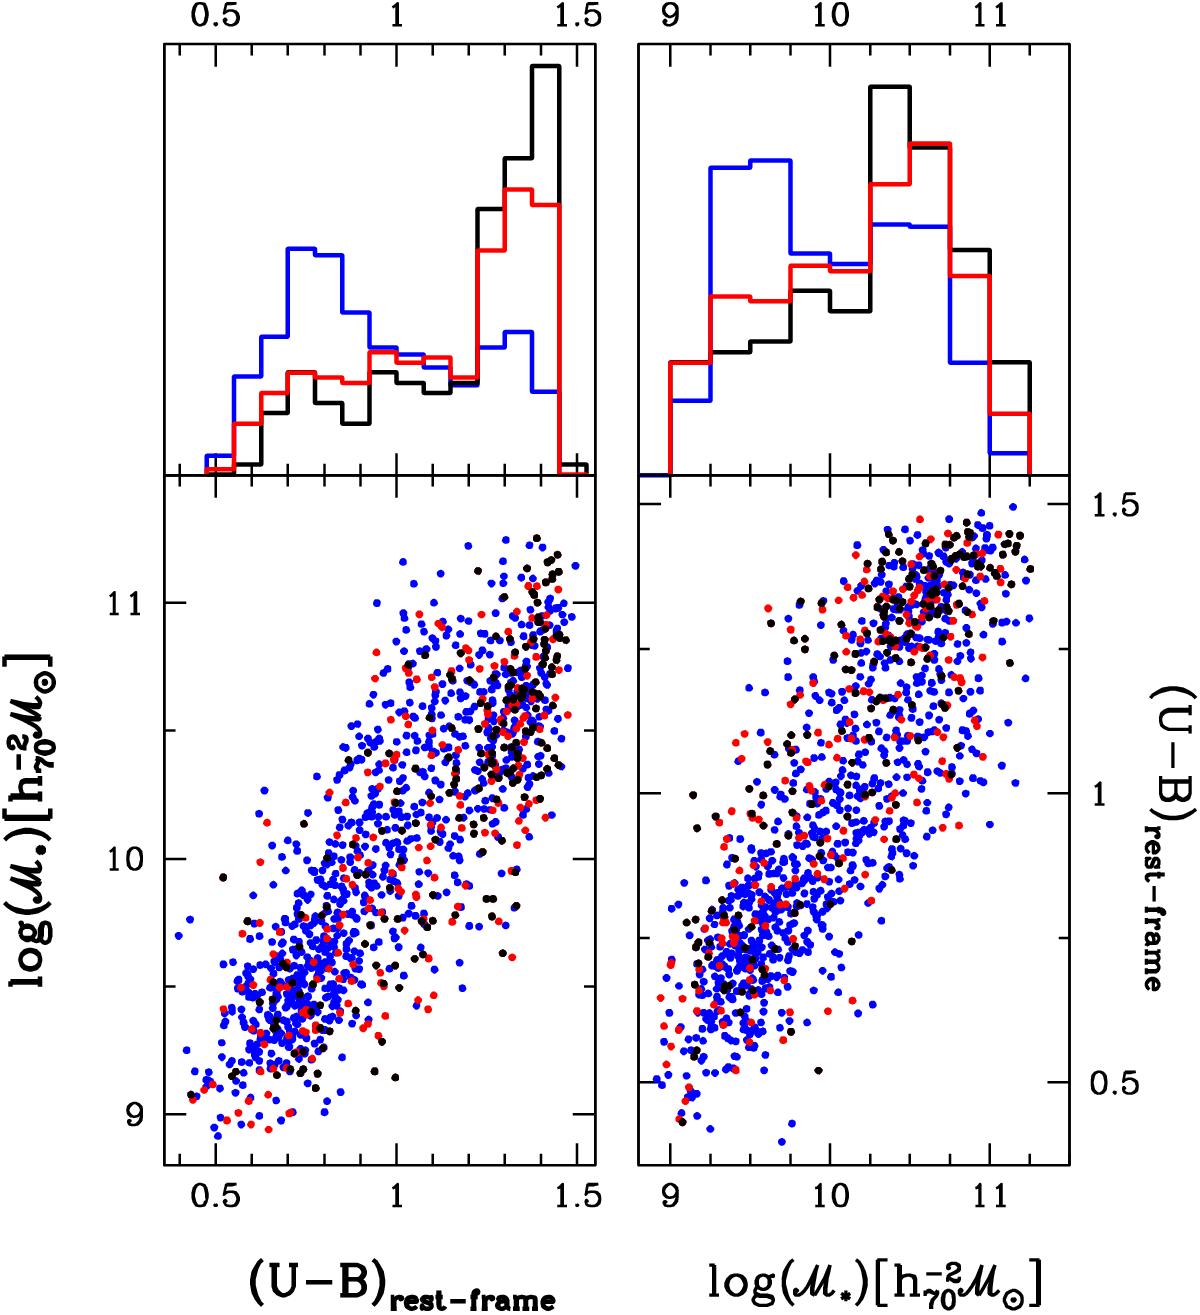
Bottom panels: show the distribution in the plane galaxy stellar mass vs. (U−B) rest-frame color (and vice versa) of all the galaxies of the Wall sample. Each galaxy is color coded according to the environment in which it resides: moving from blue to red and black, galaxies are located in progressively denser environments. Top panels: normalized distribution in (U−B) rest-frame colors (on the left) and in galaxy stellar masses (on the right) of these three samples. Moving from lower to higher densities clearly results both in redder rest-frame color distributions and in stellar mass distributions skewed toward higher masses.
Current usage metrics show cumulative count of Article Views (full-text article views including HTML views, PDF and ePub downloads, according to the available data) and Abstracts Views on Vision4Press platform.
Data correspond to usage on the plateform after 2015. The current usage metrics is available 48-96 hours after online publication and is updated daily on week days.
Initial download of the metrics may take a while.