Fig. 15
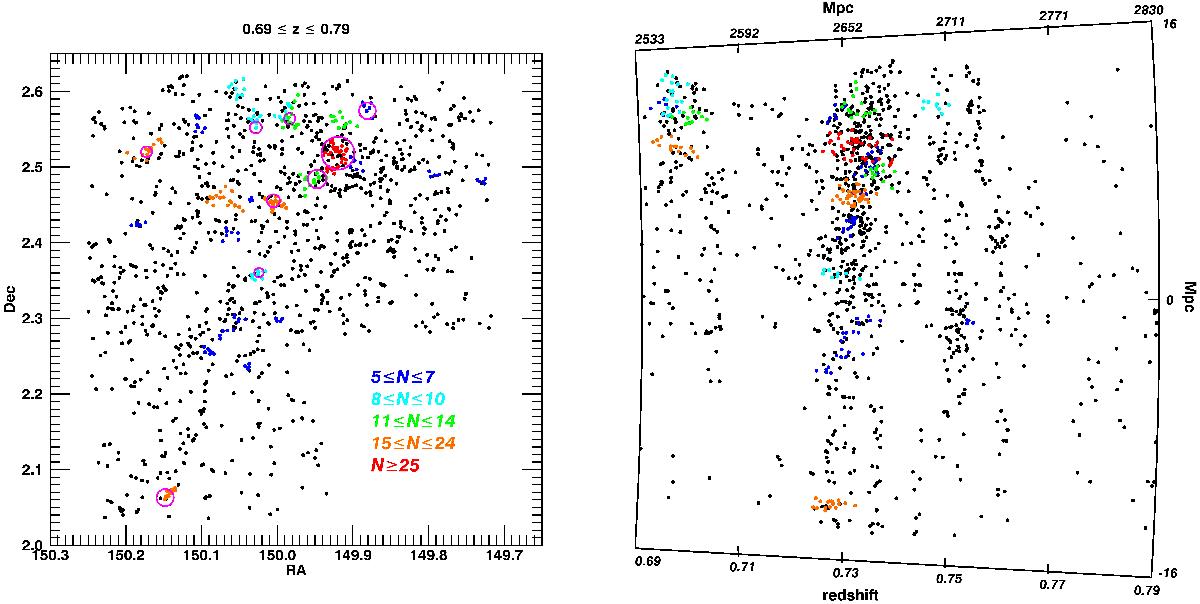
Left panel: RA-Dec distribution of the total Wall sample (black points) and group member galaxies, color coded as indicated in the legend. Large magenta open circles indicate the sky position of the extended X-ray sources from George et al. (2011). Right panel: distribution of declination and redshift for the Wall sample and group member galaxies; color legend as in the left panel. Labels on the top show distances from observer in comoving coordinates (Mpc units), while labels on the bottom show redshift values. Labels on the right indicate distances in comoving coordinates (Mpc units) from field center along Dec direction at z ~ 0.79. For the sake of clarity, in this cone diagram we compressed by a factor 10 the scale along the redshift direction.
Current usage metrics show cumulative count of Article Views (full-text article views including HTML views, PDF and ePub downloads, according to the available data) and Abstracts Views on Vision4Press platform.
Data correspond to usage on the plateform after 2015. The current usage metrics is available 48-96 hours after online publication and is updated daily on week days.
Initial download of the metrics may take a while.