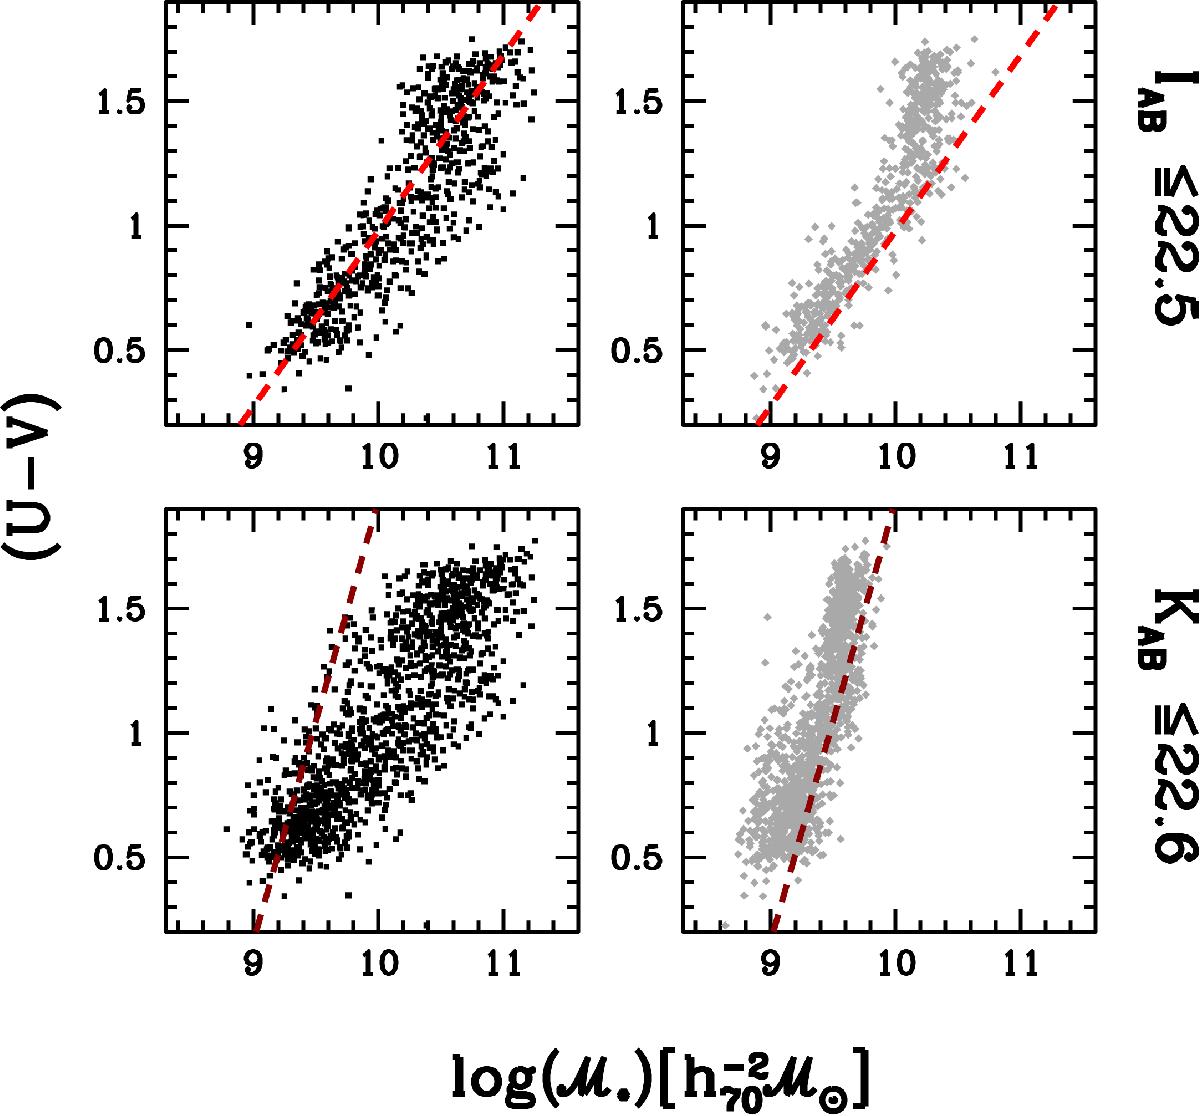
Fig. 13

Stellar mass completeness as a function of galaxy (U−V) rest-frame colors for the whole COSMOS Wall sample limited to KAB ≤ 22.6 (bottom panel) and for the subset limited at IAB ≤ 22.5 (top panel), which reproduces the completeness of the 20 K-sample. Left hand panels display the actual galaxy stellar mass distribution, while the right hand panels show the limiting masses for each galaxy, all as a function of (U−V) rest-frame colors, plotted on the y axis. The dashed lines represent the mass limits estimates.
Current usage metrics show cumulative count of Article Views (full-text article views including HTML views, PDF and ePub downloads, according to the available data) and Abstracts Views on Vision4Press platform.
Data correspond to usage on the plateform after 2015. The current usage metrics is available 48-96 hours after online publication and is updated daily on week days.
Initial download of the metrics may take a while.


