Fig. 12
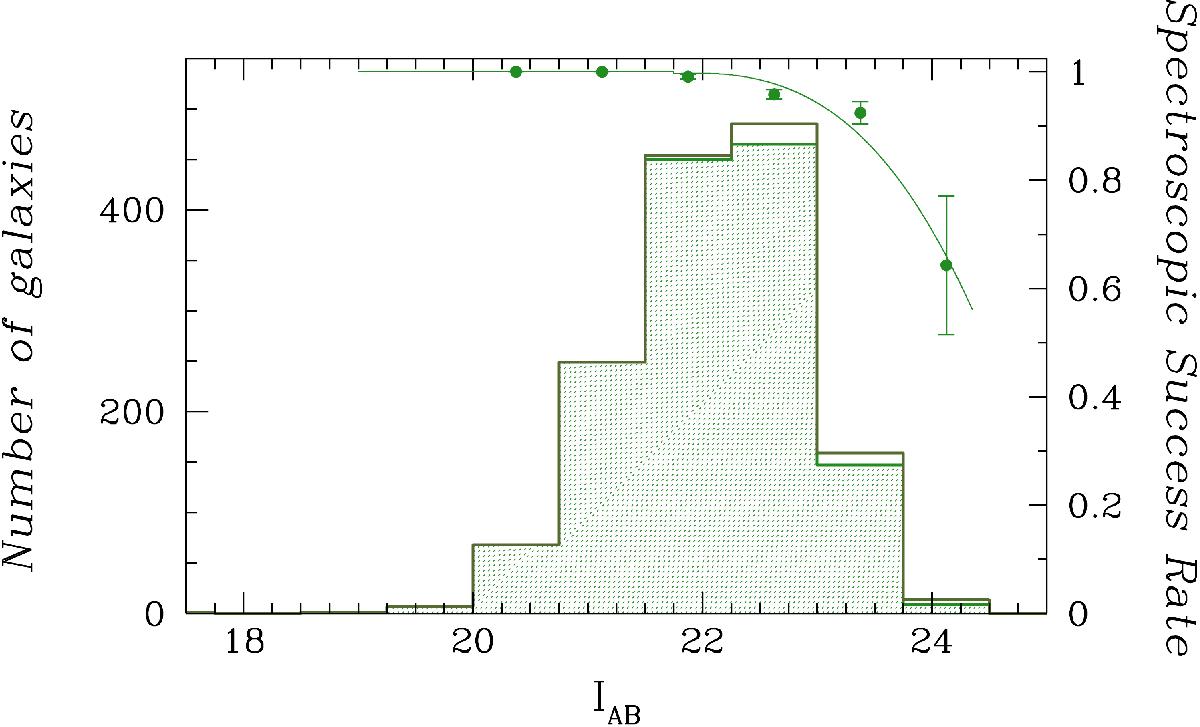
SSR as a function of a target IAB magnitude. The dark green histogram shows the magnitude distribution of the targets from the total parent sample where a slit was positioned. The filled light green histogram shows the magnitude distribution of the targets whose redshift is reliably measured (for both histograms the numbers are indicated on the left Y axis). The filled points are the SSR, which is a ratio of the two histograms whose value is indicated on the right Y axis. The continuous light green curve is the adopted function to parametrize SSR(IAB).
Current usage metrics show cumulative count of Article Views (full-text article views including HTML views, PDF and ePub downloads, according to the available data) and Abstracts Views on Vision4Press platform.
Data correspond to usage on the plateform after 2015. The current usage metrics is available 48-96 hours after online publication and is updated daily on week days.
Initial download of the metrics may take a while.