Fig. 11
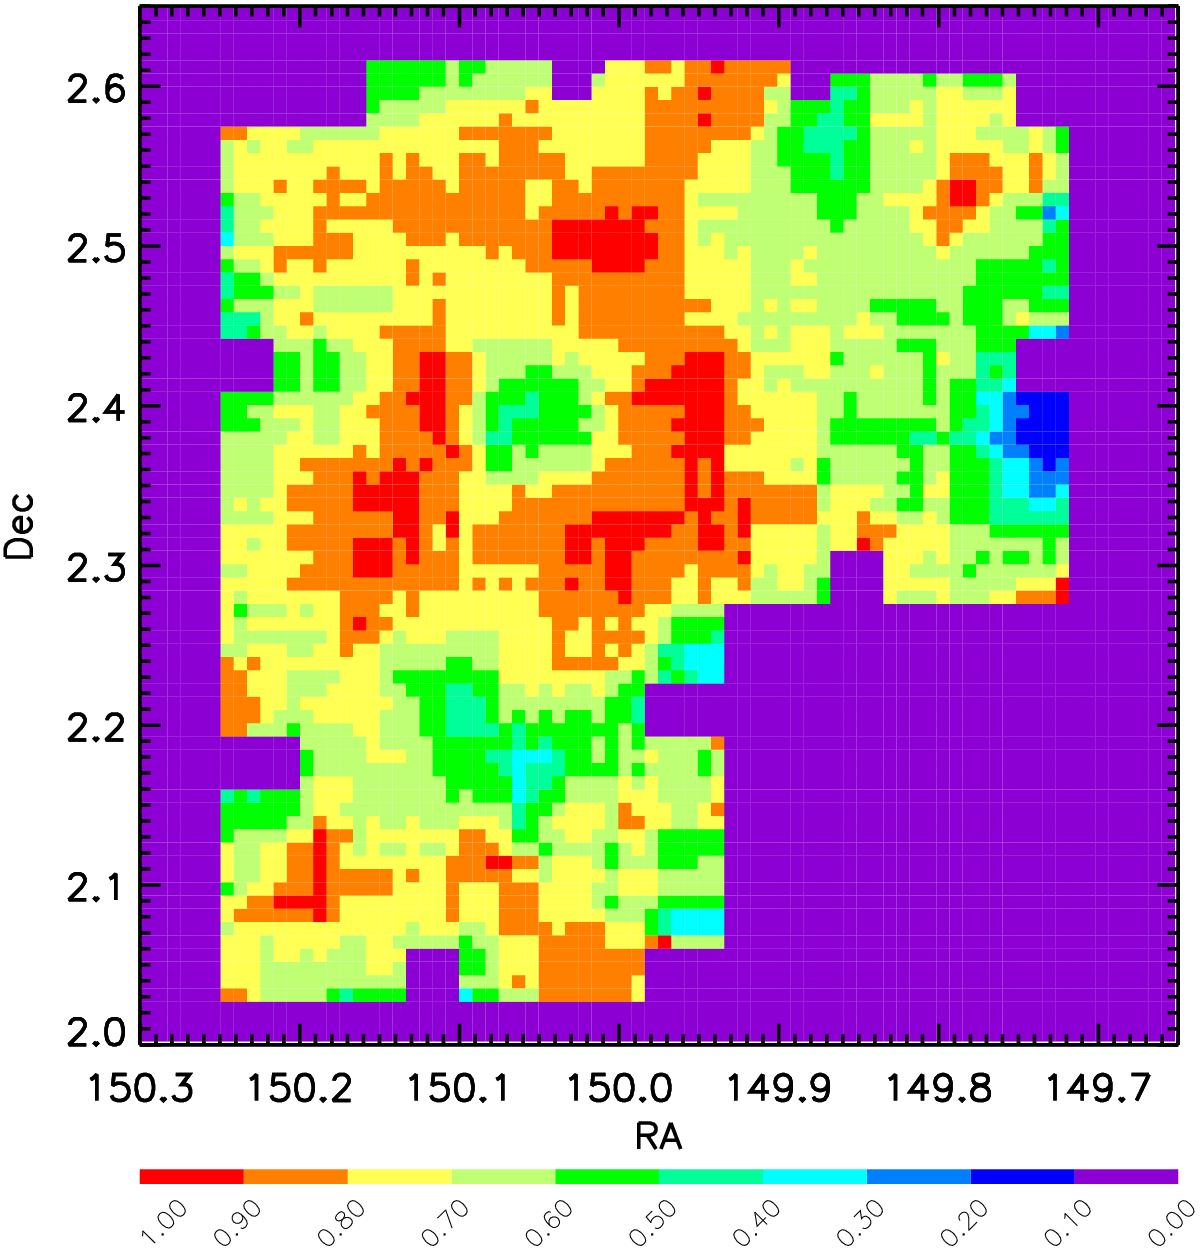
RaDec Sampling rate before normalization, showing the spatial variation of the TSR due to the sky inhomogeneities in our survey coverage. Comparing this figure with Fig. 5 it is possible to see that the highest density region where the richest structure is located suffers from a slight relative under-sampling, despite having been targeted by four different pointings.
Current usage metrics show cumulative count of Article Views (full-text article views including HTML views, PDF and ePub downloads, according to the available data) and Abstracts Views on Vision4Press platform.
Data correspond to usage on the plateform after 2015. The current usage metrics is available 48-96 hours after online publication and is updated daily on week days.
Initial download of the metrics may take a while.