Fig. 10
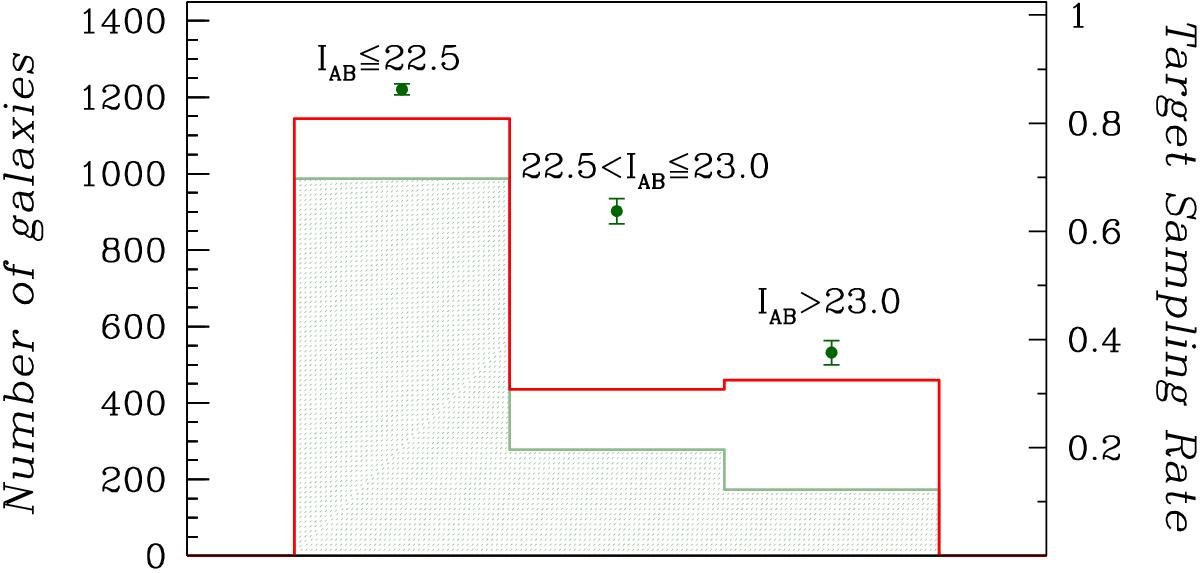
TSR in the three IAB magnitude bins, used to define our slit positioning strategy: IAB ≤ 22.5, 22.5 <IAB ≤ 23.0, IAB> 23.0. The magnitude bin considered is labeled atop of each bin. The red histogram shows the magnitude distribution of the targets in the total Wall parent sample. The filled green histogram shows the magnitude distribution of the targets where we could position on a slit (for both histograms the correponding number of targets is shown on the left y axis). The filled points are the TSR, which is ratio between the two histograms, with values given by the right y axis.
Current usage metrics show cumulative count of Article Views (full-text article views including HTML views, PDF and ePub downloads, according to the available data) and Abstracts Views on Vision4Press platform.
Data correspond to usage on the plateform after 2015. The current usage metrics is available 48-96 hours after online publication and is updated daily on week days.
Initial download of the metrics may take a while.