Fig. 1
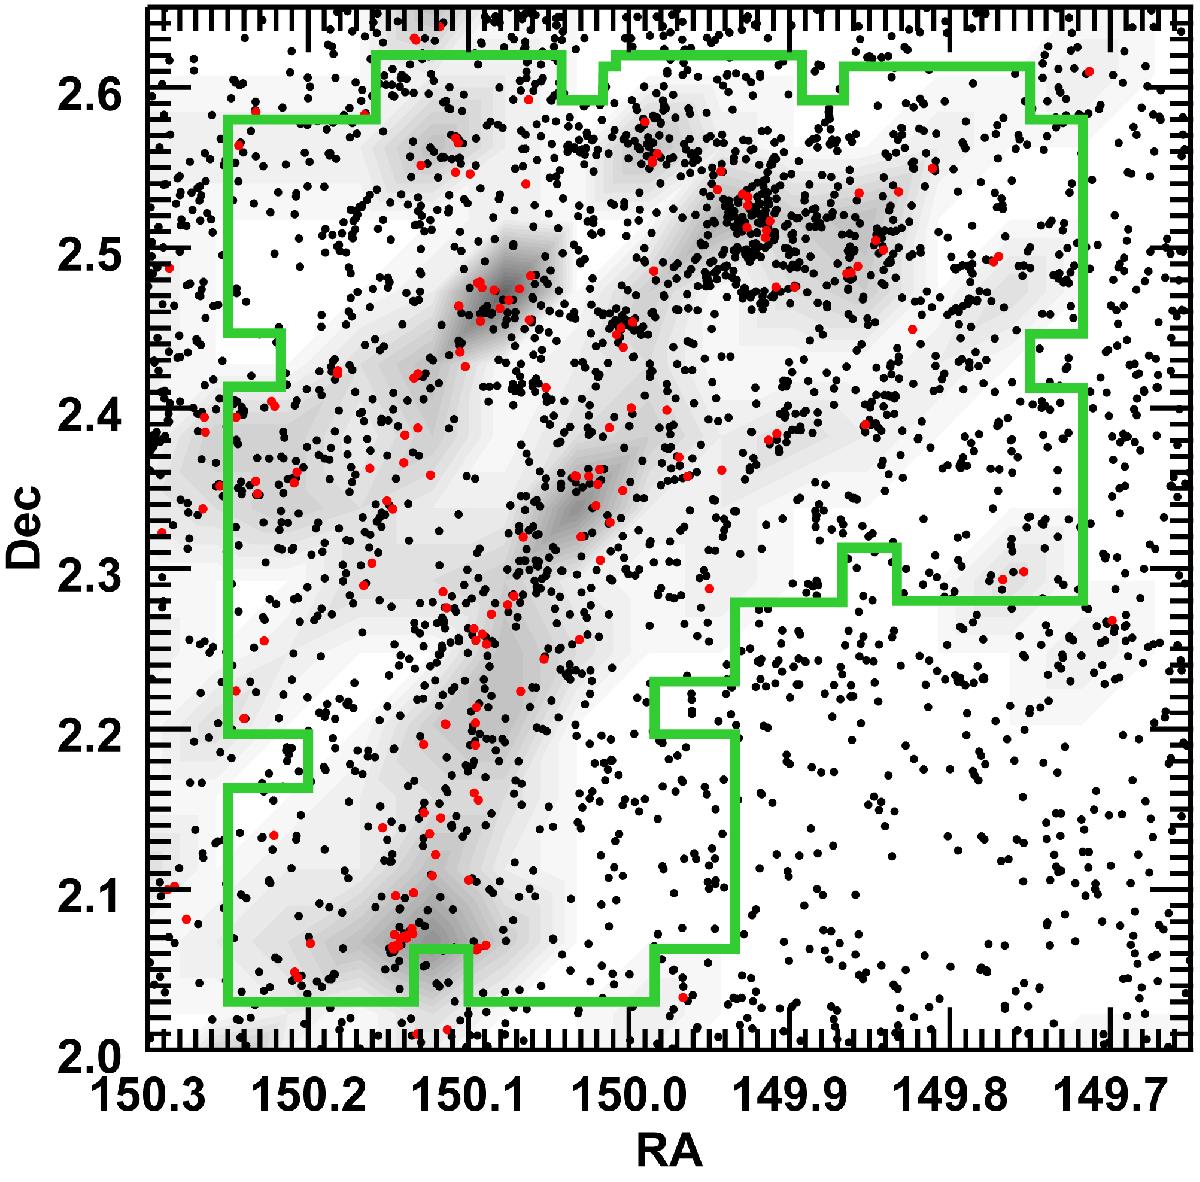
RA-Dec distribution of galaxies within the area we targeted by VIMOS observations, indicated by the green outline. Black dots represent galaxies of the 30-COSMOS photometric catalog with 0.60 ≤ zphot ≤ 0.86, while red dots (and the underlying gray contours) represent galaxies from the 20 K-sample in the range 0.72 ≤ zspec ≤ 0.74. It is possible to see the presence of a significant galaxy concentration and of two long filamentary structures pointing toward it.
Current usage metrics show cumulative count of Article Views (full-text article views including HTML views, PDF and ePub downloads, according to the available data) and Abstracts Views on Vision4Press platform.
Data correspond to usage on the plateform after 2015. The current usage metrics is available 48-96 hours after online publication and is updated daily on week days.
Initial download of the metrics may take a while.