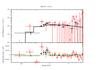
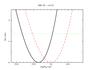
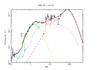
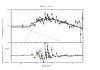
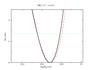
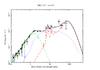
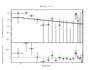
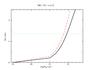
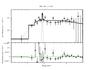
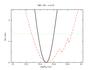
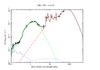
Fig. 2

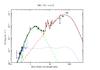
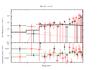
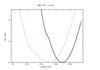
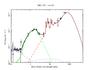
Left: X-ray spectral fits (unfolded model and residuals) for the X-ray detected DOGs in our sample. Filled circles and empty squares correspond to Chandra and XMM-Newton data, respectively. Middle: comparison between the confidence contours for the column density values computed for the 4 Ms data (dashed line) and 6 Ms data (solid line). The horizontal dotted line indicates the 90% confidence level. Right: SED fits for our X-ray DOGs sample. Solid line: full model; dotted line: AGN contribution; dash-dotted line: stellar contribution; and dashed line: starburst contribution. Our Compton-thick candidates are sources 95, 230, and 309.
Current usage metrics show cumulative count of Article Views (full-text article views including HTML views, PDF and ePub downloads, according to the available data) and Abstracts Views on Vision4Press platform.
Data correspond to usage on the plateform after 2015. The current usage metrics is available 48-96 hours after online publication and is updated daily on week days.
Initial download of the metrics may take a while.