Fig. 9
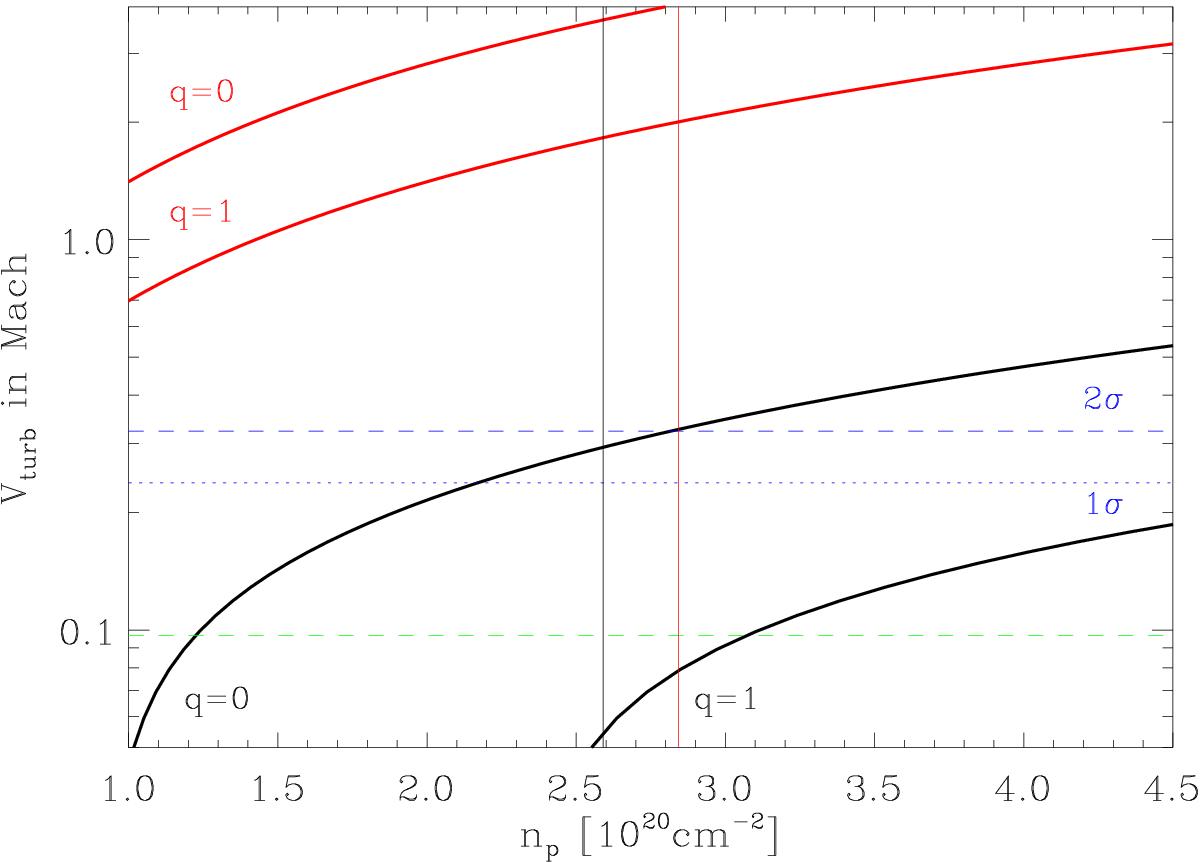
Relations between IGM proton column density and characteristic micro-turbulence velocities in regions S1 (red) and N1 (black) with derived proton columns (vertical lines). q = 0 and q = 1 refer to inhomogeneous and homogeneous distribution of emitting and absorbing ions, respectively. The blue lines are the 1- and 2σ upper limits for mean turbulent velocities in the NGC 4636 core regions, and the green dashed line marks the limit where turbulent heating is expected to balance gas cooling (see Pinto et al. 2015).
Current usage metrics show cumulative count of Article Views (full-text article views including HTML views, PDF and ePub downloads, according to the available data) and Abstracts Views on Vision4Press platform.
Data correspond to usage on the plateform after 2015. The current usage metrics is available 48-96 hours after online publication and is updated daily on week days.
Initial download of the metrics may take a while.