Fig. 8
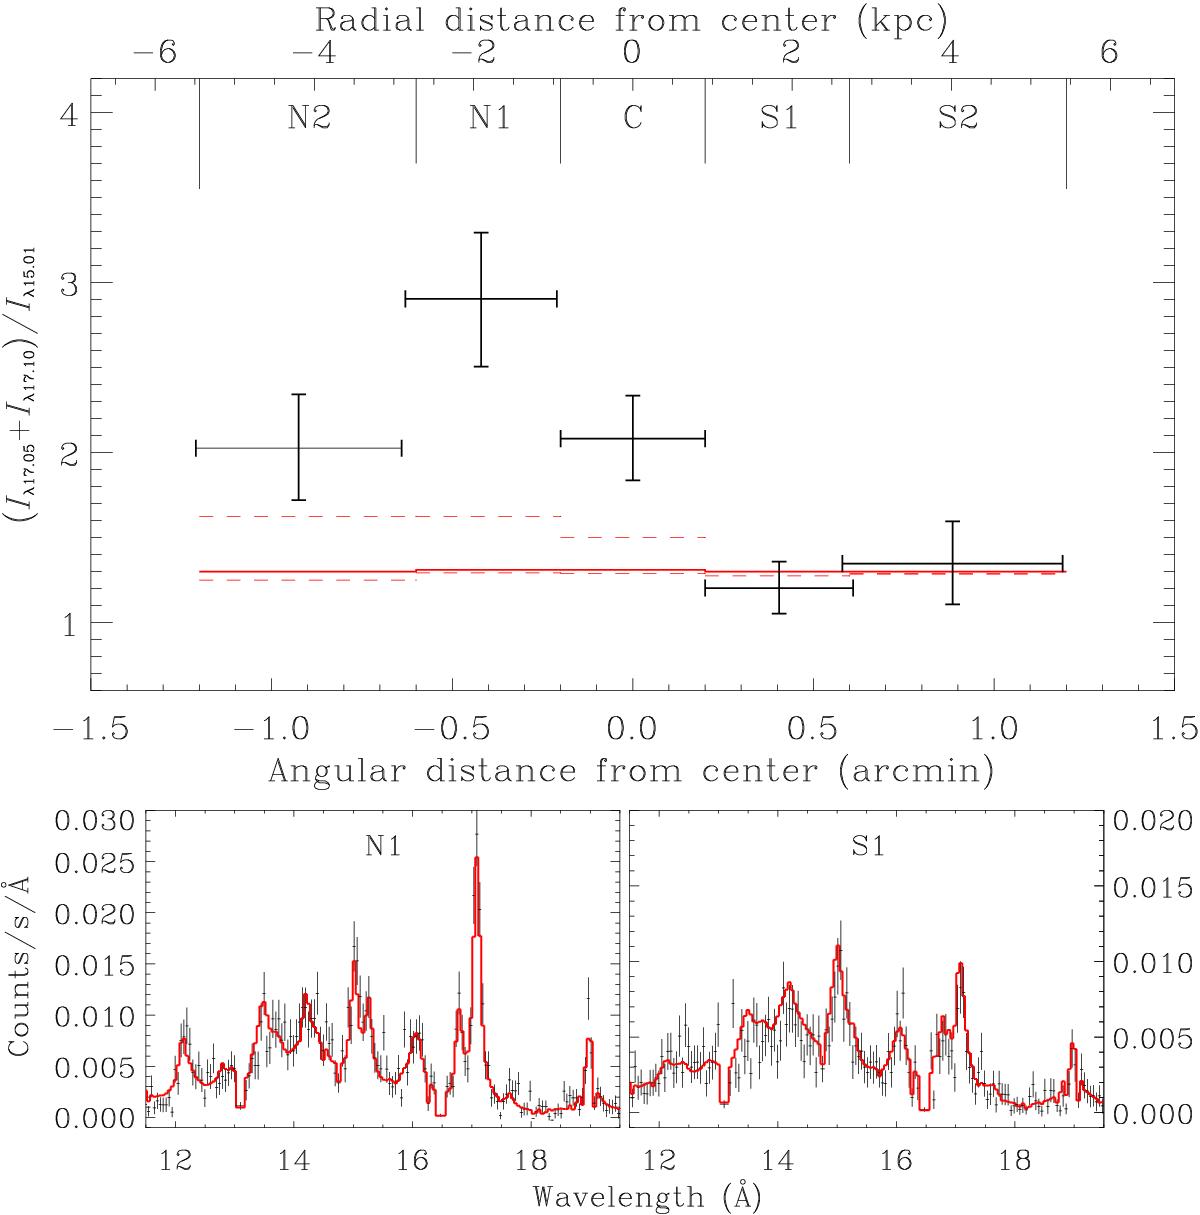
Upper plot: measured Fe xvii (Iλ17.05 + Iλ17.10) /Iλ15.01 line ratios for each RGS extraction regions. The solid red line corresponds to the predicted ratio without resonant scattering for the emission-weighted temperatures for each region, whereas the dashed lines are the predicted values for the coolest (upper) and hottest (lower) phases found in each region. The distances refer to those of the RGS cross-dispersion direction in the exposure. Bottom plot: 11.5−19.5 Å spectra from regions N1 and S1.
Current usage metrics show cumulative count of Article Views (full-text article views including HTML views, PDF and ePub downloads, according to the available data) and Abstracts Views on Vision4Press platform.
Data correspond to usage on the plateform after 2015. The current usage metrics is available 48-96 hours after online publication and is updated daily on week days.
Initial download of the metrics may take a while.