Free Access
Fig. 4
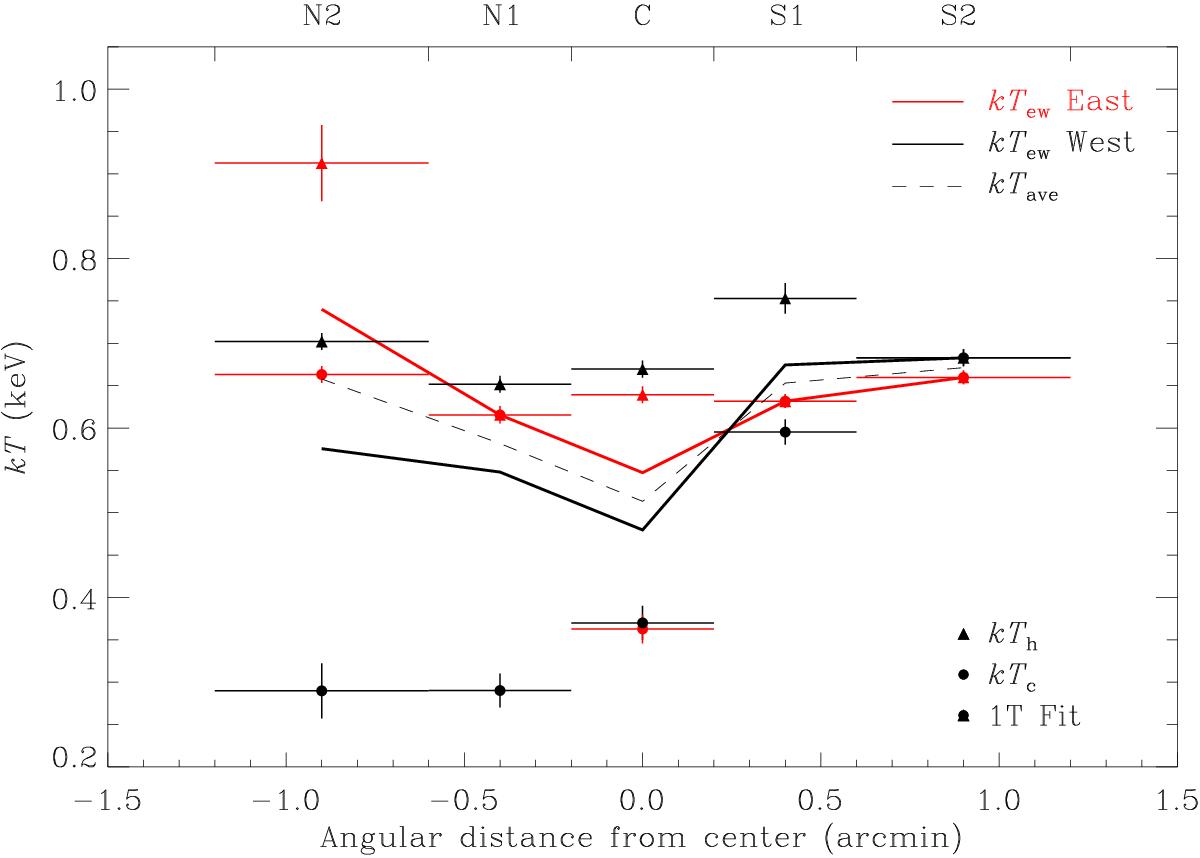
Best-fit values for temperatures of the two-component CIE models for ACIS regions plotted together with emission-weighted temperatures (solid lines) and their average (dashed line). The triangles and circles mark the hot and cold components, respectively.
Current usage metrics show cumulative count of Article Views (full-text article views including HTML views, PDF and ePub downloads, according to the available data) and Abstracts Views on Vision4Press platform.
Data correspond to usage on the plateform after 2015. The current usage metrics is available 48-96 hours after online publication and is updated daily on week days.
Initial download of the metrics may take a while.