Free Access
Fig. 10
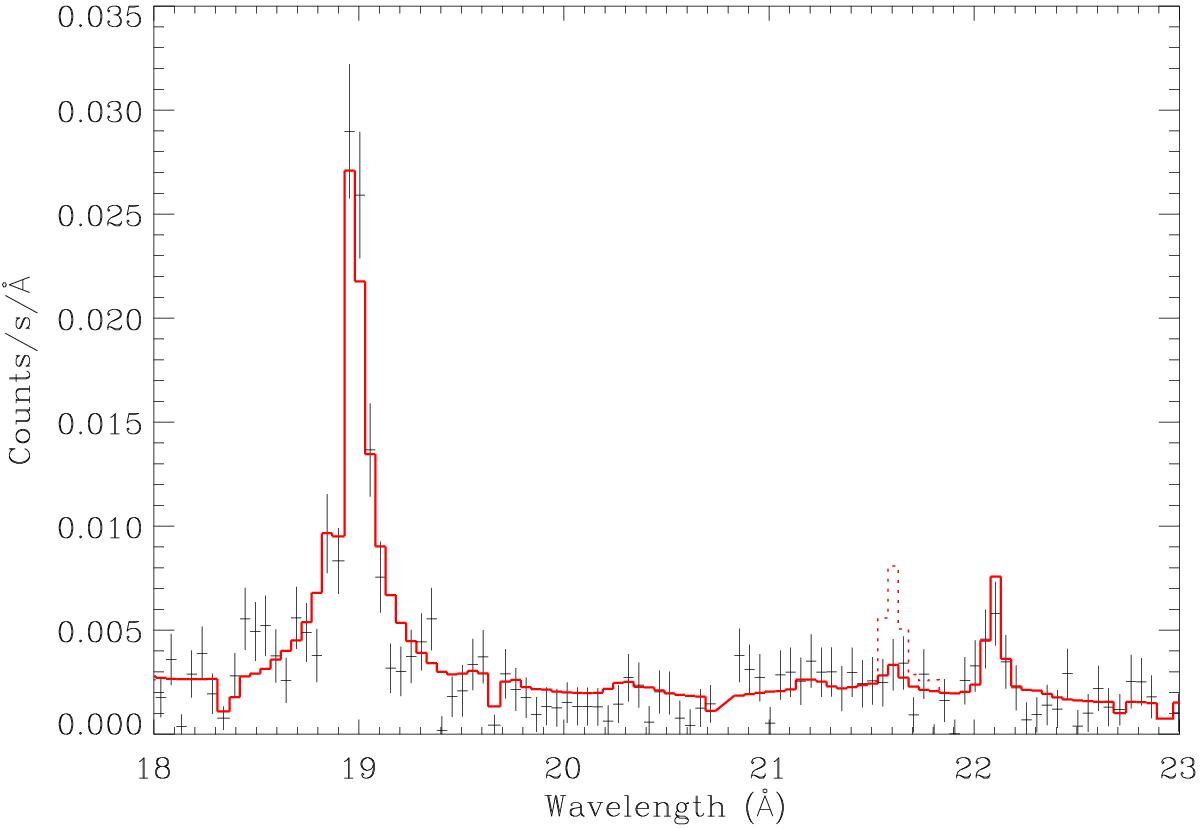
Zoom into O viii and O vii lines in a global fit of the RGS1 extraction region (−1.0′, 0.4′). The dashed line shows the predicted O vii triplet shape as normalized to the best-fit model forbidden line intensity, revealing strong suppression of the 21.6 Å resonance line.
Current usage metrics show cumulative count of Article Views (full-text article views including HTML views, PDF and ePub downloads, according to the available data) and Abstracts Views on Vision4Press platform.
Data correspond to usage on the plateform after 2015. The current usage metrics is available 48-96 hours after online publication and is updated daily on week days.
Initial download of the metrics may take a while.